Thursday Jul 30, 2026
Thursday Jul 30, 2026
Saturday, 7 October 2023 00:57 - - {{hitsCtrl.values.hits}}
Sri Lanka continues to sustain a near $ 1 billion trade deficit as evidenced by August external trade data released this week.
By end July cumulative trade deficit was $ 971 million whilst in August it amounted
$ 925 million.
In the first eight months of this year the cumulative deficit in the trade account narrowed to $2,964 million from $3,889 million recorded over the same period in 2022, due to a larger decline in imports offsetting the decline in exports, the Central Bank said.
In recent months however, the difference in the deficit has narrowed. In the first quarter of this year the deficit was better at $ 861 million, low er by $ 1.5 billion from $ 2.4 billion in the 1Q of last year. In the first half the deficit was $ 2.28 billion, less than $ 1.2 billion as against $ 3.5 billion a year ago.
However in August the deficit in the merchandise trade account widened to $ 307 million, compared to $ 260 million recorded a year ago.
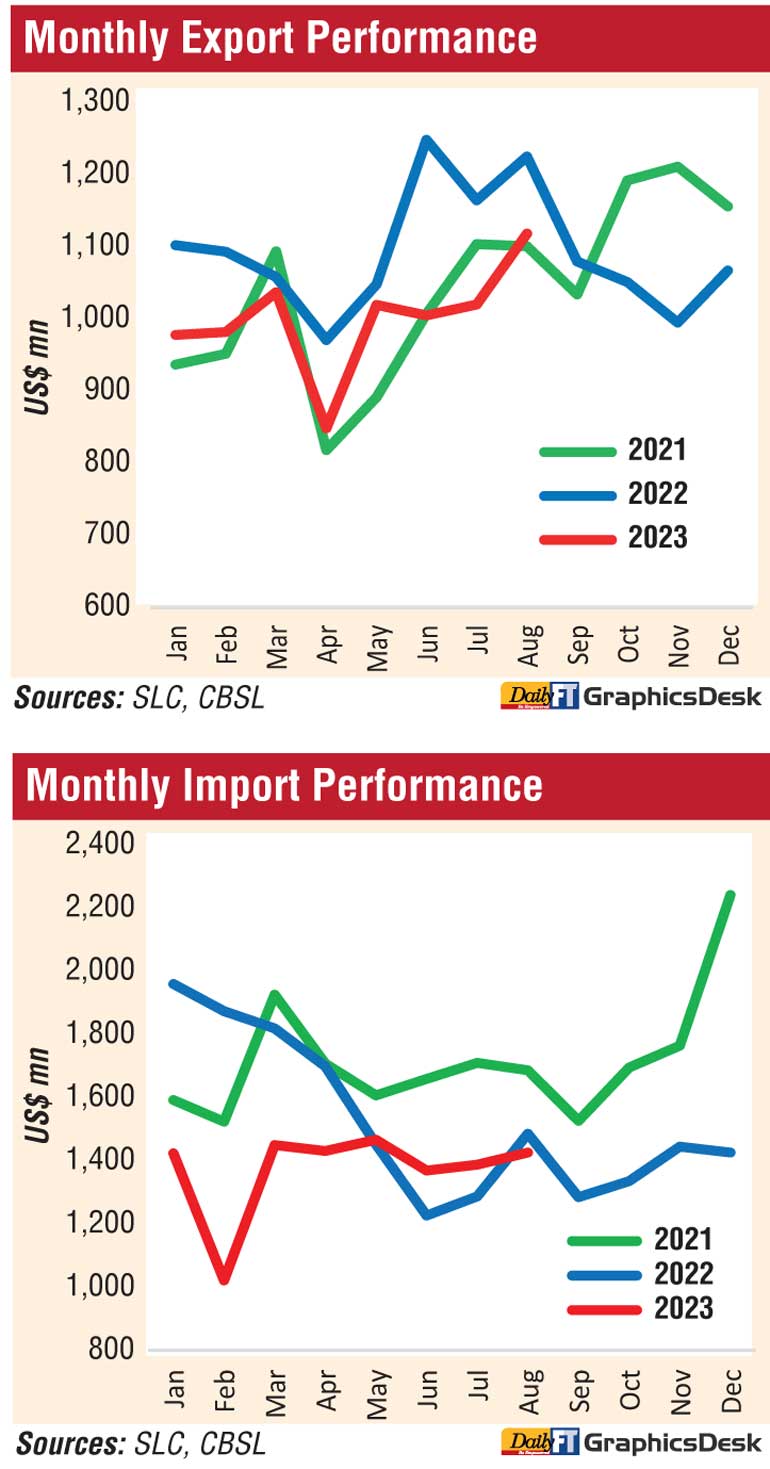
Overall exports: Earnings from exports in August 2023 marked the highest monthly earnings so far in 2023. However, earnings from merchandise exports declined by 8.7% in August 2023, YoY, to $ 1,119 million. The decline in export earnings was mainly driven by industrial exports, particularly garments, due to a continued slowdown in external demand. Cumulative export earnings during January to August 2023 also declined by 10.1% over the same period in the last year, amounting to $ 8,010 million.
Industrial exports: Earnings from the export of industrial goods continued to witness a decline in August 2023 as well, compared to a year earlier, and a significant share of this decrease can be attributed to garments, which offset the increase recorded in export of transport equipment. The export of garments recorded a 20% decline during the eight months ending August 2023, recording a decline in earnings from most of the major markets (the USA, the EU and the UK).
Moreover, there was a substantial downturn in the export of rubber products (mainly, tires and gloves); and animal fodder (mainly, wheat residues); among others.
However, earnings from the export of transport equipment (specifically a ship); food, beverages and tobacco; and petroleum products (driven by increased volumes of bunker and aviation fuel exports) increased in August 2023.
Agricultural exports: Earnings from the exports of agricultural goods declined in August 2023, compared to a year ago, mainly due to the decrease in earnings from seafood (mainly, fresh fish), tea, and coconut related products (mainly, fibres and desiccated coconut). Earnings from tea exports declined driven by lower export prices, while export volumes experienced a slight increase in comparison to August 2022. However, there was an increase in earnings from spice exports, mainly pepper, driven by significant increase in export volumes in August 2023.
Mineral exports: Earnings from mineral exports declined in August 2023, compared to August 2022, primarily attributed to a decrease in export earnings from earths and stone (mainly, quartz).
Overall imports: Expenditure on merchandise imports declined by 4.0% (YoY) to $ 1,426 million in August 2023. However, a marginal increase in import expenditure is observed from June 2023 onwards, on a month-on-month basis, partly supported by the relaxations of import restrictions. The decline in import expenditure was primarily driven by intermediate goods, despite expenditures on consumer goods and investment goods imports recorded an increase.
Cumulative import expenditure during January to August 2023 declined by 14.3% to $ 10,974 million, compared to the same period in the previous year.
Consumer goods: Expenditure on the importation of consumer goods increased in August 2023, compared to a year earlier, driven by the increases in expenditure on both food and non-food consumer goods.
Expenditure on non-food consumer goods increased mainly due to telecommunication devices (primarily mobile phones), medical and pharmaceuticals and household and furniture items. Additionally, the increase in expenditure on food and beverages was driven by the importation of dairy products (mainly, milk powder), oils and fats (mainly, coconut oil) and seafood (mainly, preserved fish). However, there was a decrease in imports of cereals and milling industry products (particularly, rice), and sugar and confectionery.
Intermediate goods: Expenditure on the importation of intermediate goods declined in August 2023, compared to a year ago, mainly driven by the reduced expenditure on textiles and textile articles (primarily, fabrics and yarns); fuel; wheat; and rubber and articles thereof. Additionally, various other categories of intermediate goods, including chemical products, plastics, and articles thereof, paper and paperboard and article thereof and mineral products also showed a decrease. Despite significant increase in volume of crude oil imports, overall fuel expenditure recorded a decline, primarily due to a decrease in the expenditure of refined petroleum products resulting from both lower volumes and prices in August 2023.
However, the categories of intermediate goods that recorded an increase include fertiliser, base metals and agricultural inputs, compared to a year ago.
Investment goods: Import expenditure on investment goods increased in August 2023, compared to August 2022 as well as July 2023. The increase in imports of machinery and equipment (primarily, turbo jets) mainly contributed to this increase. However, imports of building material and transport equipment recorded a decline in August 2023 compared to a year earlier.
Terms of trade, i.e., the ratio of the price of exports to the price of imports, deteriorated by 5.1% in August 2023, compared to August 2022, as the decline in the prices of exports surpassed the decline in the prices of imports.
The export volume index increased by 10.6%, while the unit value index declined by 17.5% in August 2023, compared to August 2022, implying that the decrease in export earnings in August 2023 was mainly a result of the drop in unit prices.
The import volume index improved by 10.3%, while the unit value index declined by 13.0% in August 2023, compared to August 2022, indicating that the reduction in import expenditure in August 2023 was primarily driven by lower unit prices.
