Sunday Jun 14, 2026
Sunday Jun 14, 2026
Thursday, 13 January 2022 00:19 - - {{hitsCtrl.values.hits}}
Provisional Tea Industry Performance in Summary – 2021
By Forbes and Walker Tea Brokers
Review 2021
The year 2021 commenced positively with the Tea Trade continuing to adapt itself to the ‘New Normal’. Virtual meetings and the culture of remote work took precedence during the year. This however did not hamper the progress of the industry despite other external challenges faced, both in the local and international arena.
Digitisation of the Auction System, which was a major stepping stone for the Tea Trade last year, continued successfully in its journey with further sophistication and advancements which have helped strengthen the trading aspect whilst creating more opportunities for stakeholders to enhance their knowledge with access to real-time Data Driven features that were introduced by the New Technology partner, OKLO with its New Platform named ‘SMART AUCTION’.
The year 2021 saw an aggressive drive of vaccination programmes across the globe with the gradual commencement of social gatherings and movements across most sectors. As a result, business and commerce witnessed a degree of recovery in the early stages of the year. In addition, regular COVID testing also helped control the spread of the virus.
However, towards mid-year, with the discovery of the Delta variant, negative ramifications were experienced globally with lockdowns and restrictions brought back. This wave resulted in a significant number of casualties, with the most affected being the Asian continent.
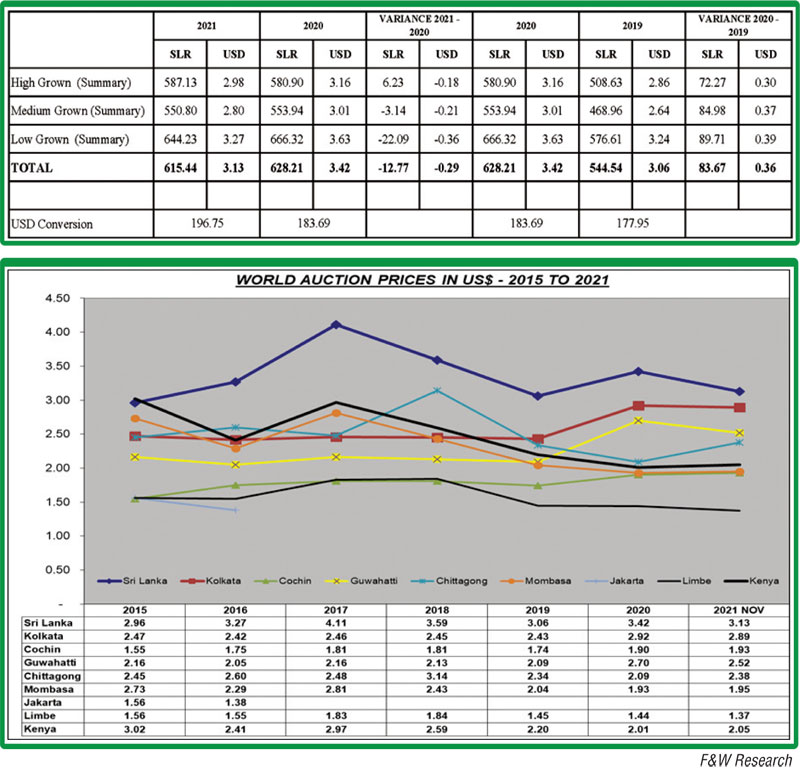
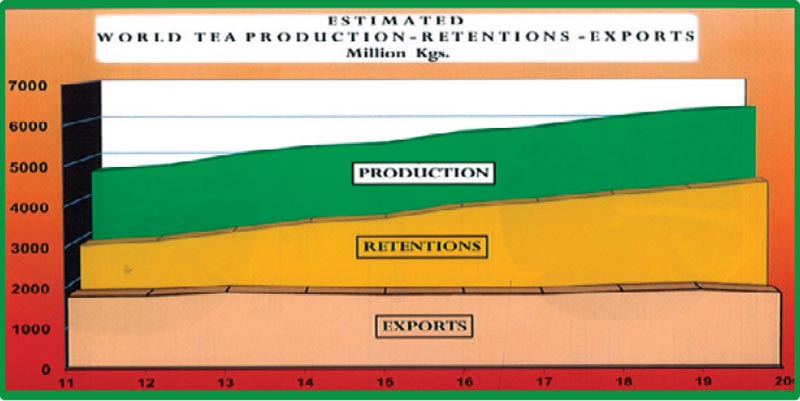
Global tea production fell in 2020 after a continuous increase for many years – a combination of the ill effects of COVID-19 and possibly the adverse climatic conditions in many major tea producing countries. Kenya would be the only exception where tea production has increased quite significantly and largely reflects the cyclical recovery after a drought induced decline in 2019.
Consequently, the year 2021 commenced with a tight supply position where the supply/demand equation could be considered to have been more or less on the balance.
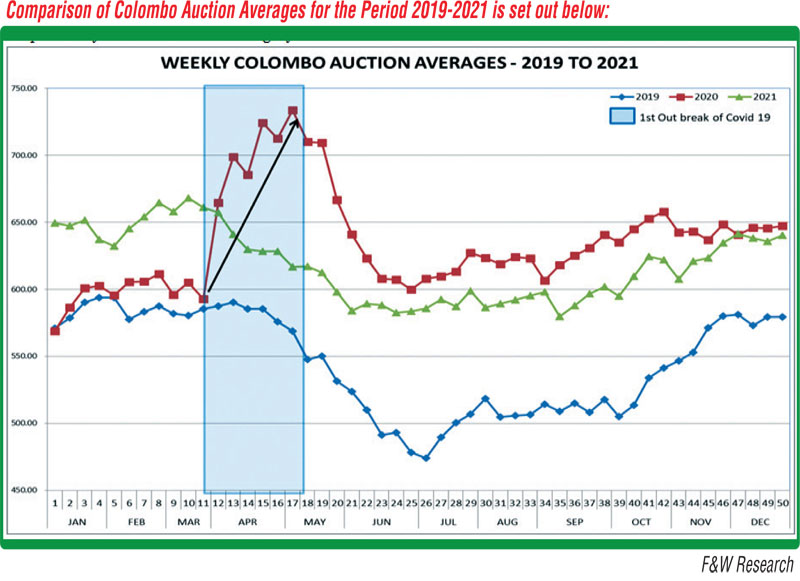
The year 2021 commenced with a steep movement in prices in the first quarter in comparison with 2020. Reopening of markets and trade routes which showed signs of positive prospects mainly contributed to the increase.
Thereafter, a marginal decline was experienced towards mid-March coinciding with the fourth wave of the COVID-19 pandemic experienced in Sri Lanka in the year 2021. As auction offerings continued to increase throughout the first quarter of 2021 vis-à-vis the COVID-19 pandemic induced decline in 2020, Colombo auction prices began to make a correction towards mid to end-May.
The weakening of the rupee did not have the desired impact on tea prices, primarily due to the sharp increase in freight rates and to a lesser extent other input costs – packing materials etc. Rather unfortunate for the tea sector.
Quarterly update
First Quarter 2021
Production
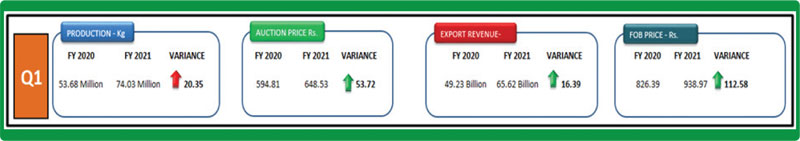
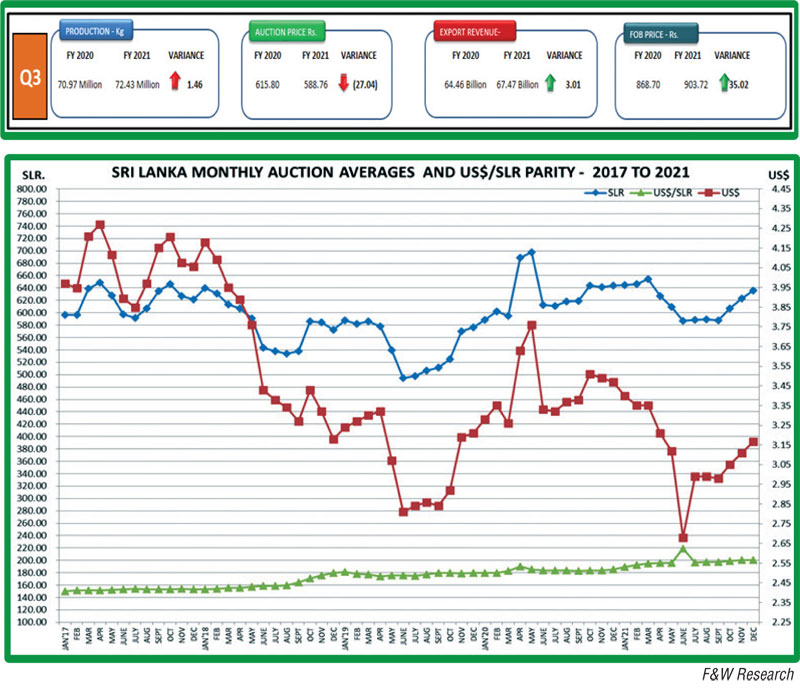
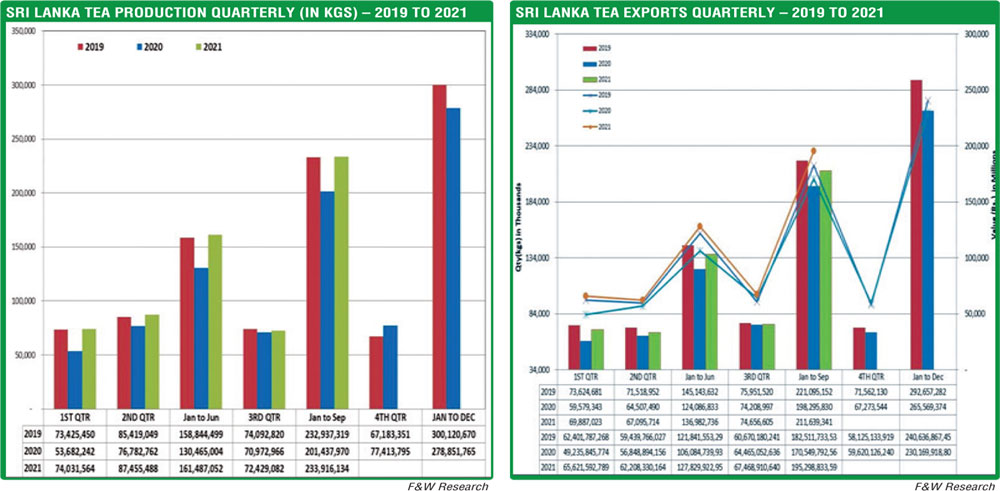
Sri Lankan tea production increased to 74.0 m/kg from a 53.6 m/kg during the corresponding period in 2020 (an increase of 37%).
Auction averages/prices
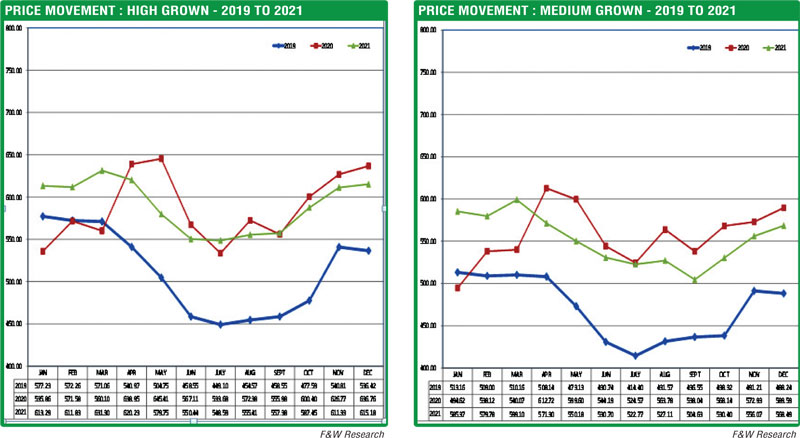
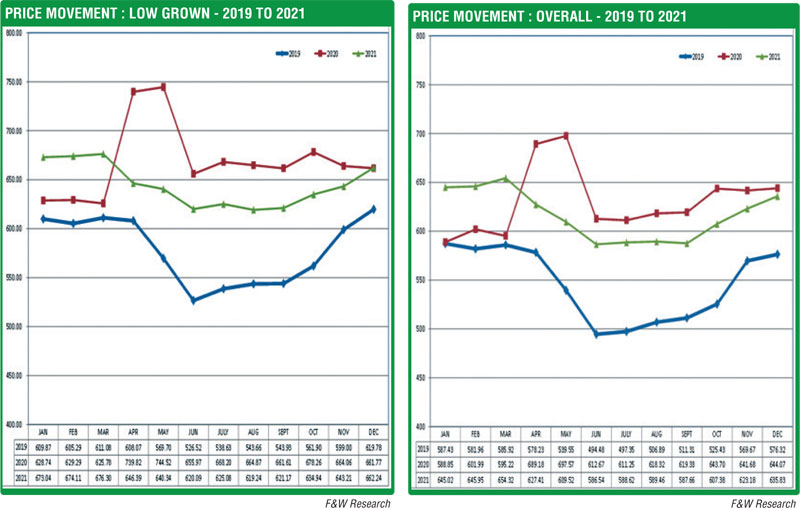
Total auction average of Rs. 648.53 showed an increase of Rs. 53.72 compared to Rs. 594.81 recorded during the first quarter in 2020. High Growns recorded an increase of Rs. 65.03 together with the Mid Growns Rs. 67.67 and Low Growns Rs. 46.14 quarter on quarter.
Exports
Tea exports totalled 69.8 m/kg, recording an increase of 10.3 m/kg vis-à-vis 59.5 m/kg during the corresponding quarter in 2020. Earnings from tea exports of Rs. 65.6 billion records an increase of Rs. 16.4 billion vis-à-vis Rs. 49.2 billion during January-March 2020. Overall FOB values too increased to Rs. 938.97 in 2021 from Rs. 826.39 in 2020.
Second Quarter 2021
Production
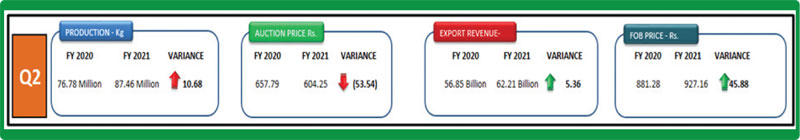
Total tea production of 87.4 m/kg recorded an increase of 10.6 m/kg vis-à-vis 76.8 m/kg during April-June 2020. During this period, Low Growns showed an increase of 5.6 m/kg followed by positive variances of 2.2 m/kg and 2.5 m/kg from the High and Medium Grown regions respectively.
Auction averages/prices
All elevations recorded a sharp decline in the auction prices. In the second quarter of 2021, Low Growns declined by Rs. 71.24 followed by Medium Growns Rs. 32.17, High Growns Rs. 31.84 and the total Colombo auction average by Rs. 53.54 when compared to the COVID enhanced corresponding period of 2020. Furthermore, a significant decline on prices quarter on quarter – High Growns Rs. 42.44, Medium Growns Rs. 41.95, Low Growns Rs. 40.96 and the overall average by Rs. 44.28.
Exports
Tea exports totalled 67.0 m/kg, recording a marginal increase of 2.5 m/kg vis-à-vis 64.5 m/kg during the corresponding quarter in 2020. Export earnings totalled Rs. 62.2 billion, recording an increase in earnings of Rs. 5.4 billion compared to Rs. 56.8 billion in 2020. FOB value of Rs. 927.16 recorded an increase of Rs. 45.88 vis-à-vis Rs. 881.28 of the corresponding quarter in 2020.
Third Quarter 2021
Production
Production totalled 72.4 m/kg during the quarter under review, with a marginal increase of 1.4 m/kg when compared to the 71.0 m/kg harvested during the corresponding quarter in 2020. End third quarter recorded an increase of 32.9 m/kg (16%).
Auction averages/prices
High Growns continued to record a marginal increase in quarterly auction prices following the limited availability on offer, whilst the Medium Growns and Low Growns recorded a decline vis-à-vis the corresponding prices in 2020.
Exports
Tea exports totalled 74.6 m/kg marginally behind 74.2 m/kg in 2020. Export earnings of Rs. 67.5 billion recorded an increase vis-à-vis Rs. 64.5 billion in 2020. End third quarter 2021, tea exports totalled 211.6 m/kg vis-à-vis 198.3 m/kg in 2020, an increase of 13.3 m/kg. Export earnings totalled Rs. 195.3 billion vis-à-vis Rs. 170.5 billion, which records an increase of Rs. 24.8 billion in earnings.
Fourth Quarter 2021 – Interim
At the time of compiling this report, industry data pertaining to the period under review remains incomplete.
Production
October/November production totalled 44.0 m/kg, recording a decline of 4.7 m/kg. Whilst this would be the only quarter to show a negative variance in production and if December production would equal the five-year monthly average of 25 m/kg – annual production for the year 2021 would exceed 300 m/kg.
Auction averages/prices
Tea prices in the fourth quarter continued to show an improvement on the third quarter. Total auction average of Rs. 621.06 records a gain of Rs. 32.30 from Rs. 588.76 in the previous quarter. High Growns Rs. 604.41 vs. Rs. 553.69, a quarter-on-quarter gain of Rs. 50.72. Mid Growns Rs. 550.28 vs. Rs. 519.31, a quarter-on-quarter gain of Rs. 30.97. Low Growns Rs. 645.19 vs. Rs. 621.66, a quarter-on-quarter gain of Rs. 23.53.
Total auction average of Rs. 621.06 during the quarter showed a decline of Rs. 22.09 compared to Rs. 643.15 recorded during the corresponding period in 2020. All elevations recorded a decline in prices. High Growns Rs. 17.68, Mid Growns Rs. 26.82 and Low Growns Rs. 22.65.
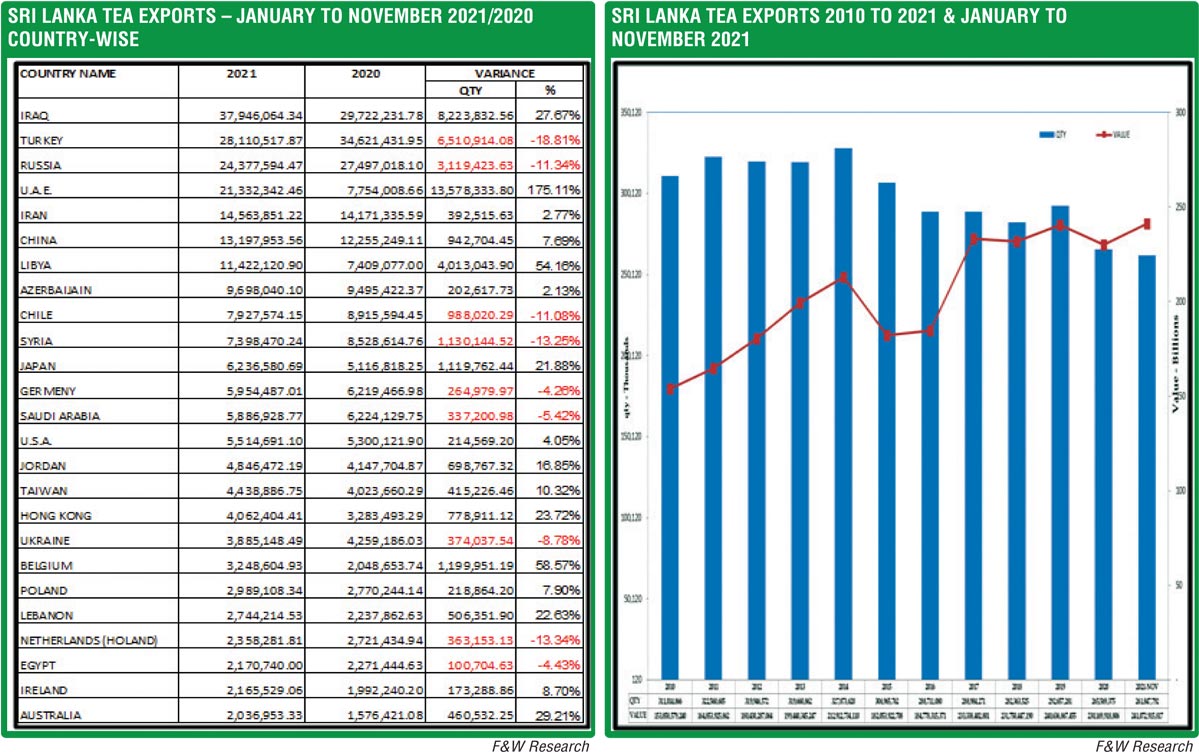
Exports
According to the available data for the period October/November exports totalled 50.2 m/kg vis-à-vis 43.3 m/kg during the corresponding period in 2020. This records an increase of 6.9 m/kg which brings the to date export surplus up to end November to 20.2 m/kg. Export earnings totalled Rs. 45.8 billion for the period October/November vis-à-vis Rs. 38.5 billion in 2020, an increase in 2021 earnings against the previous year and bringing the to date increase in earnings up to end November to Rs. 32 billion.

Sri Lanka macroeconomic update – 2021
The year began under the cloud of the COVID-19 pandemic although the second wave of October 2020 had been somewhat under control. The main worry the economy was faced with was the ability of the country to meet its debt obligations which were falling due in January and July 2021.
The debt position was made to look worse when all three major rating agencies downgraded the Sri Lanka Development bonds towards the end of 2020. One of the rating agencies further downgraded Sri Lanka at the end of 2021, although the move was refuted by the Central Bank of Sri Lanka.
The country had to also face a resurgent third and fourth wave of COVID in Q2 and Q3 of the year before the success of the vaccination drive enabled the country to fully function in Q4 of the year. On the brighter side the economy was recovering from a low base due to the massive decline in the second quarter of 2020.
The exporters were the mainstay of the economy with revenue from tourism and worker remittances impacted by the pandemic. The impact from tourism and the shortfall in worker remittances could be estimated at around $ 7.5 billion for the year. The hope for 2022 would be that this figure will be restored to a great extent and will provide a sufficient cushion when the debt repayment kicks in. It is most likely the import controls would continue for another year.
Economic growth
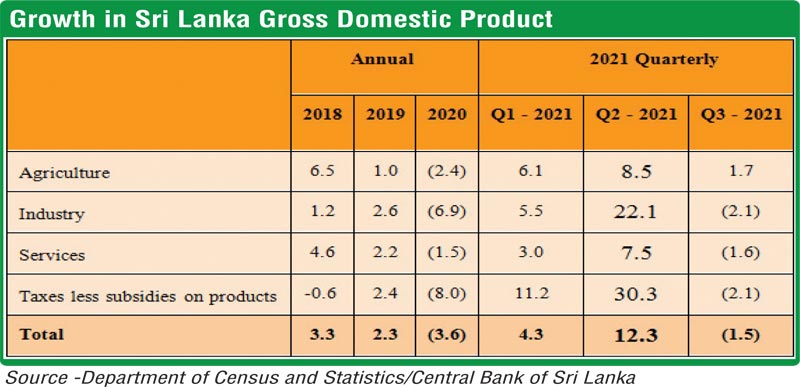
The Gross Domestic Product of the Sri Lankan economy contracted by 3.6% in 2020 against 2.3% and 3.3% growth figures recorded in 2019 and 2018 respectively. The GDP in 2021 recorded growths of 4.3% and 12.3% for Q1 and Q2 respectively. However, Q3 recorded a contraction of 1.5%.
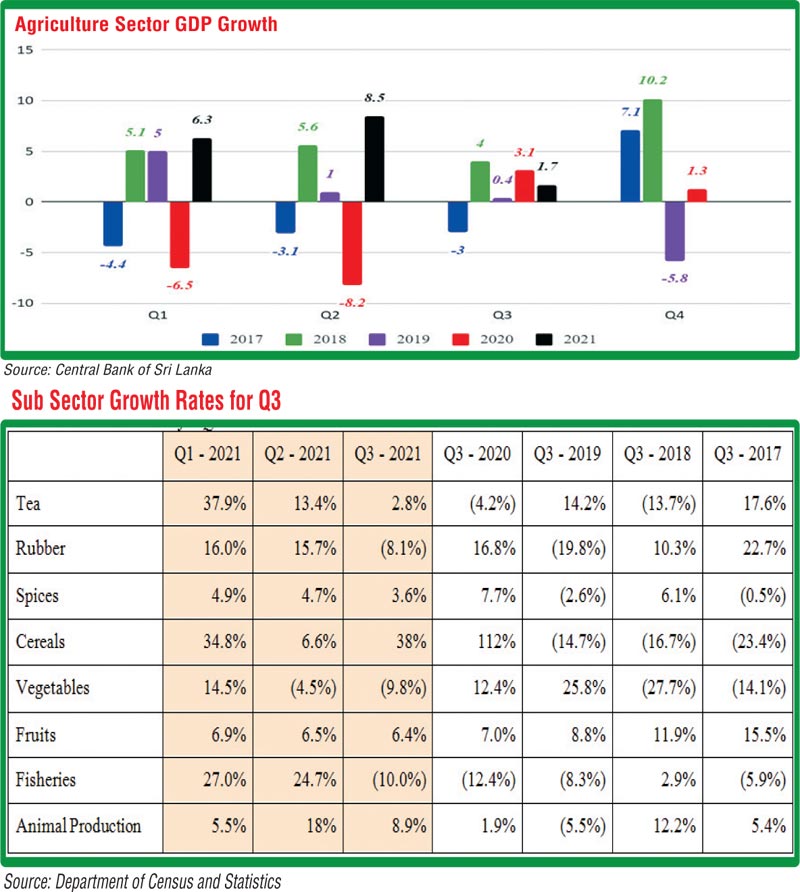
Agriculture Sector performance
The second quarter of 2021, saw the agriculture sector as a whole report a substantial expansion. The growth of 8.5% in agriculture is the best quarterly growth since Q4 of 2018
External Sector
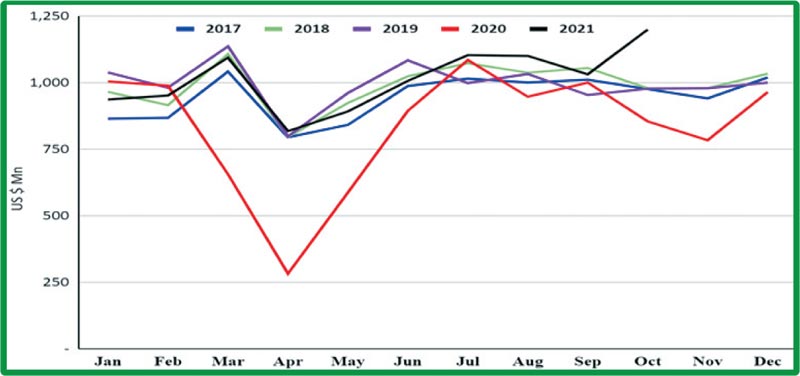
Merchandise Exports
The Exports Earnings for the year is expected to close on $ 12.5 billion. This is a significant YOY growth against $ 10.0 billion achieved in the pandemic hit 2020. Importantly, the 2021 export earnings have recorded better results against that achieved in pre-pandemic levels in 2019, which was $ 11.9 billion.
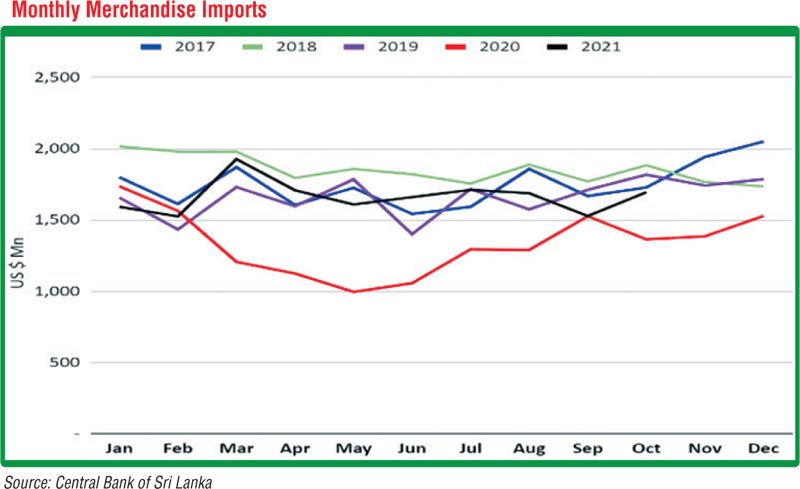
Merchandise Imports
The total merchandise imports for the year could be estimated at around $ 19.8 billion. This would be a 23% increase from 2020, which was valued at $ 16,055 Mn.
Based on the January to October figures, the increase in expenditure on intermediate goods (YoY increase of 34.2%), Medical and Pharmaceuticals (increase of 39.7%) and machinery/equipment categorised under investment goods (increase of 27.8%) contributed to the increase in import expenditure.
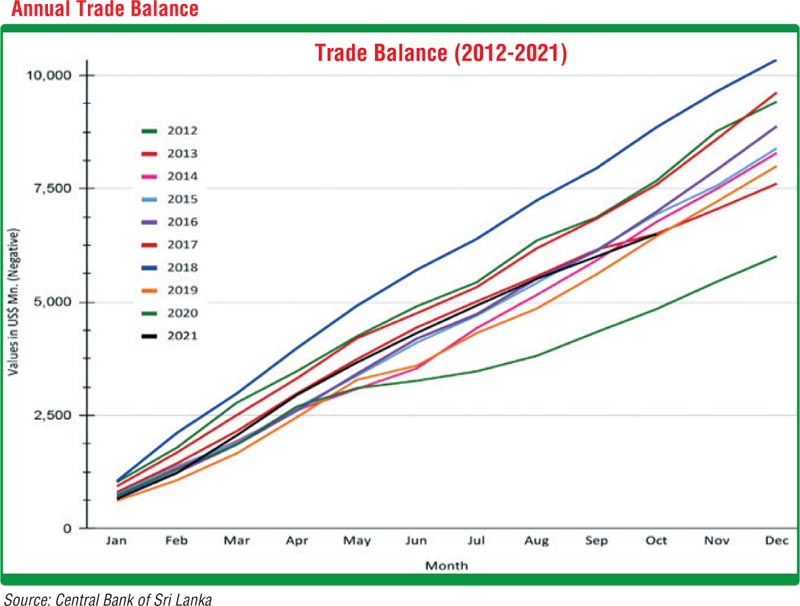
Trade Account
The negative trade balance of over $ 6.5 Billion for the period from January to October in 2021 is a clear indication that the Sri Lankan economy is still very much import driven. The exports lag the imports by over 50% and therefore, a two-pronged strategy to increase exports while reducing imports is necessary to manage the trade account. A 10-year analysis shows that we would probably be heading towards the lowest trade deficit since 2012.
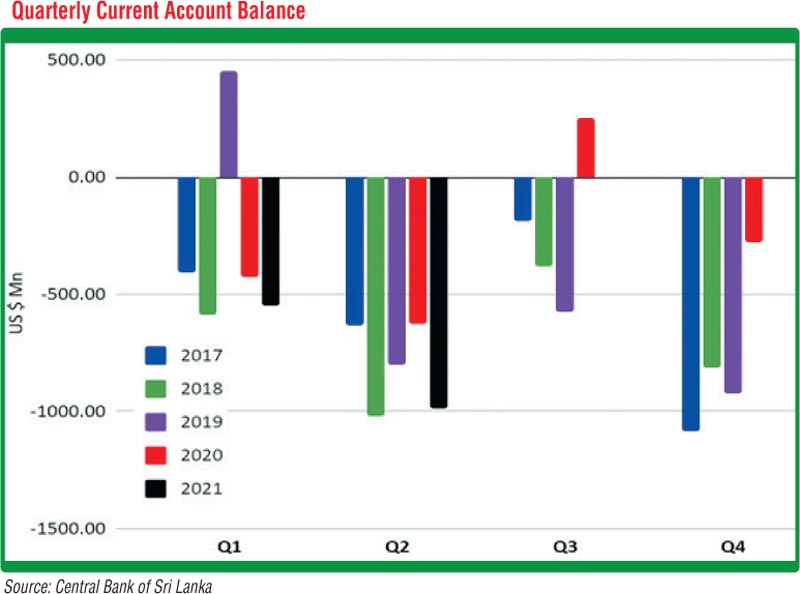
Current Account Balance
The current account represents a country's imports and exports of goods and services, payments made to foreign investors, and transfers such as foreign aid. Generally, the Sri Lankan economy has shown a negative even in the current account despite the income from expatriate remittances, tourism and other services. We have observed only two quarters with positive current account balances in the past five years.
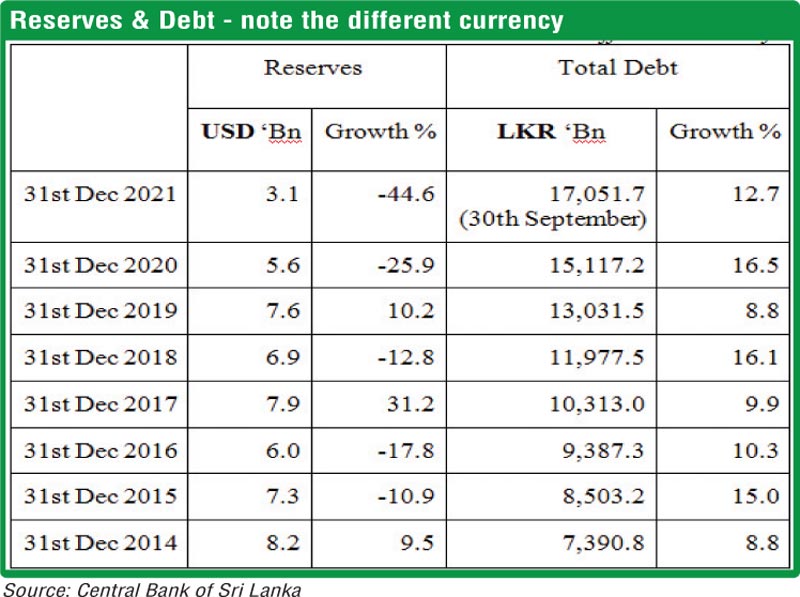
Loans and reserves
We continue to see a dwindling of the official reserves over the past few years, while the debt figure keeps mounting. The currency swaps and other short-term measures will help the country overcome the issue in the short term. However, the structural changes to the economy (Port City, Colombo Fort Development, Special Economic Zones, Sale of underutilised assets) to attract the long-term FDI is critically important.
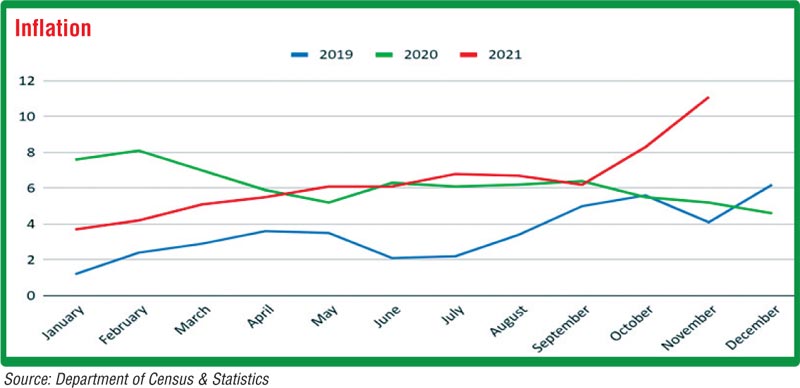
Inflation
Inflation as measured by the movement in the National Consumer Price Index (NCPI) was 11.1% in November 2021 (4.6 % in December 2020). It is observed that inflation in 2020 which began at 7.6% in January 2020 ended the year at 4.6%, while in 2021 the trend was reversed where the inflation rises from 3.7% in January to 11.1% by November 2021.
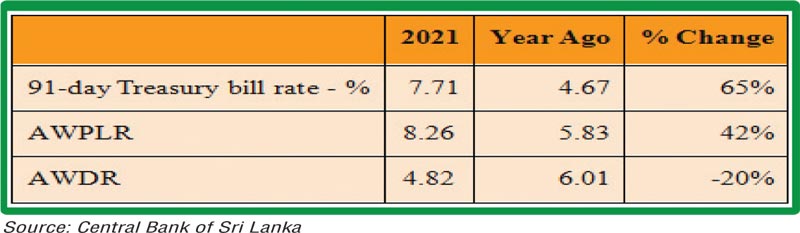
Interest rates
The treasury bill rates increased in 2021 against 2020. The average prime lending rates by banks too increased.
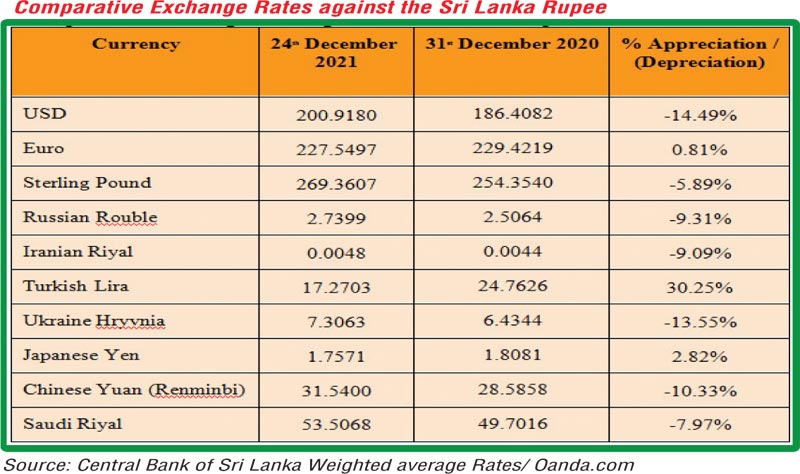
Exchange rates
During the 2021, the rupee has depreciated against most currencies as stated below.
Market outlook for 2022
Predicting the market outlook for Ceylon Tea for the year 2022 at this juncture amidst much uncertainty seems a difficult task. Nevertheless, we have analysed the supply and demand situations that exist, and projected based on the likely market scenarios and the recent developments in importer countries.
In analysing the supply situation, it would be relevant to segregate the Orthodox and CTC tea production. 2020 Ceylon Tea production of 278.8 m/kg records the lowest since1997. 2021 has shown a welcome recovery primarily following favourable weather conditions, which in all probability is unlikely to be maintained in 2022.
Therefore, Kenyan tea production will play a significant role when assessing the total global supply situation. Perhaps another factor that needs due consideration as we have regularly highlighted is the growing demand for tea in producer countries, which has left lesser exportable volumes.
India with its aged plantations show little promise in growth when reviewing data over a period of time. On the other hand, Kenya and the African Region, in general, have shown steady growth in production over the past several years recording a historical 569 m/kg in 2020. Although 2021 records a decline on its historical performance in 2020, still shows a growth of approximately 15% in comparing a five-year average.
Production prospects for 2022 are fairly firm and global tea production may revert to approximately 2% growth. Sri Lanka may be an exception owing to the withdrawal of chemical fertiliser in and around mid-2021, and its ill effects which are likely to take its toll in Q1 of 2022.
Since the Government has recently reversed the ban on chemical fertiliser some degree of recovery is anticipated commencing Q2 of 2022, subject to extreme weather conditions not being a reality. However, ageing tea bushes and low productivity levels continue to be a downside.
The market deficit expanded in 2020 as production fell significantly in most producer countries largely due to the COVID-19 pandemic and perhaps to a lesser extent due to climatic conditions.
In 2021, both production and consumption would record a growth with perhaps production increasing more rapidly. Therefore, the market deficit is likely to have narrowed in comparison to end 2020.
Tea consumption is likely to be dominated by Asian consumers, particularly China and India. China, in particular, has been an important market for Ceylon Tea in recent times. Analysts predict that out of home consumption in China is likely to recover in the coming year helping to drive stronger growth in overall tea consumption.
Similarly, consumption in India too is likely to show further growth on 2021 data which remained weak with the closures amidst surging COVID-19 cases. The Indian market would have significant potential from its sheer size and India’s average per head consumption.
The US could be singled out as a fast-growing market, particularly for instant tea and the iced tea segments. Interestingly, imports from Sri Lanka to the US too have shown useful growth in recent years.
As highlighted previously in the report, Colombo auction prices have shown a significant appreciation in the fourth quarter vis-à-vis Q3 – a combination of factors triggering improved demand, lower volumes, better quality and in anticipation of the unusually lower volumes in the forthcoming quarter of 2022.
Other factors that are likely to impact on prices:
These factors would enable us to predict stronger rupee tea prices for the first half in 2022, in general and Q1 in particular. Market demand for teas thereafter would greatly depend on how the global tea industry would progress during the first half. However, as we have periodically highlighted, market demand for good quality teas will continue to command a premium consistently throughout the year as it is envisaged that there is a dearth of good quality teas.
Amidst this optimistic outlook for tea prices, the industry continues to be challenged with ‘climate change’ and constant wage increases, more so in the current context of high inflation, which would continue to undermine the competitiveness due to the higher average production cost compared to other larger producer/exporter countries.
In our view, the industry as a matter of urgency needs to adopt and mitigate the adverse effects of ‘climate change.’ Rehabilitating and improving the water retention capacity of the soil should be a priority followed by a systematic in-filling program carried out in the short term.
In the medium term, a structured re-planting program should be pursued in a manner in which a high degree of mechanisation can be achieved in agricultural practices, particularly the harvesting function. Therefore, the global competitiveness of ‘Ceylon Tea’ in the short to medium term will depend on how quickly the industry addresses these vital issues.


