Thursday Jun 11, 2026
Thursday Jun 11, 2026
Tuesday, 22 March 2022 03:16 - - {{hitsCtrl.values.hits}}
The Manufacturing and Production (M&P) sector is a vitally important one to Sri Lanka, contributing 15.5% of the nation’s GDP and employing 17.5% of the total labour force (CBSL, 2020). With the start of the pandemic in 2020, lockdowns have affected the industry at varying levels, with some, such as the food industry continuing to function due to the essential goods classification, whereas other areas have struggled. In addition, significant safety precautions have had to be put in place subsequently. Nevertheless, we have seen activities return to normalcy over the past year and a steady revival.
Considering this opportune moment to assess the performance of the sector in terms of workplace culture and employee satisfaction, Great Place to Work surveyed over 17,000 employees (representing 35,000 employees), across the sector to compile the inaugural list of Best Workplaces in the Manufacturing and Production industry. The Great Place to Work For All model was used to select the 10 Best Workplaces accounting for employee perception through the Trust Index survey, and organisational people practices through the Culture Audit completed by the organisation and independently assessed.
Results overview
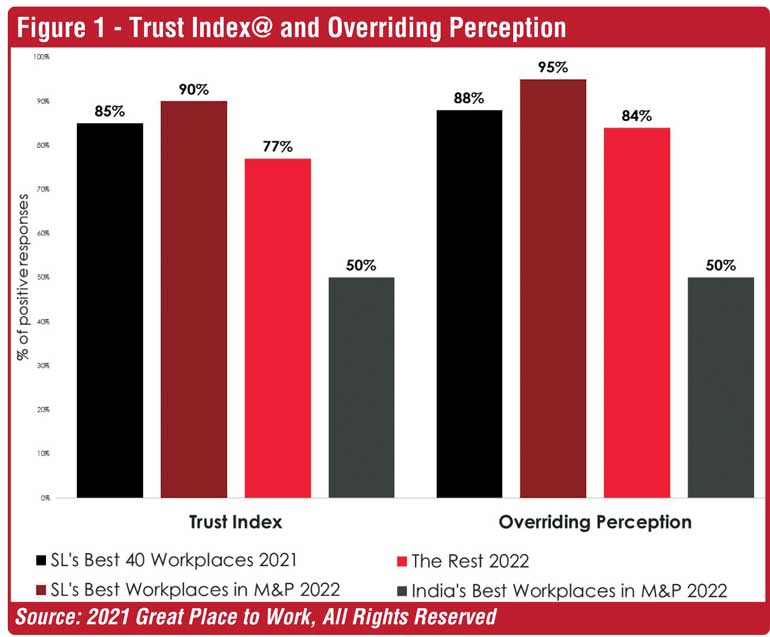
To begin, we can see that the average Trust Index score or average positive perception of employees of the 10 Best Workplaces in M&P is 90%, a notable 5% higher than the 2021 benchmark for Sri Lanka – the average positive perception of employees of the 40 Best Workplaces in Sri Lanka (Figure 1). There is an even larger difference – 7% higher – for the Overriding Perception, or the positive response to the generalised statement “Taking everything into account, I would say this is a great place to work.” Compared to the average result for Best Workplaces for Manufacturing in India, Sri Lanka is has performed notable higher, as well.
In terms of understanding the difference between the 10 Best Workplaces and the rest of the organisations surveyed in the M&P industry, the gap is clear with a 13-point difference for the average perception and a smaller margin of 11 points for the Overriding Perception. The rest of this article explores specific insights of the Best 10 and the differences with the Rest.
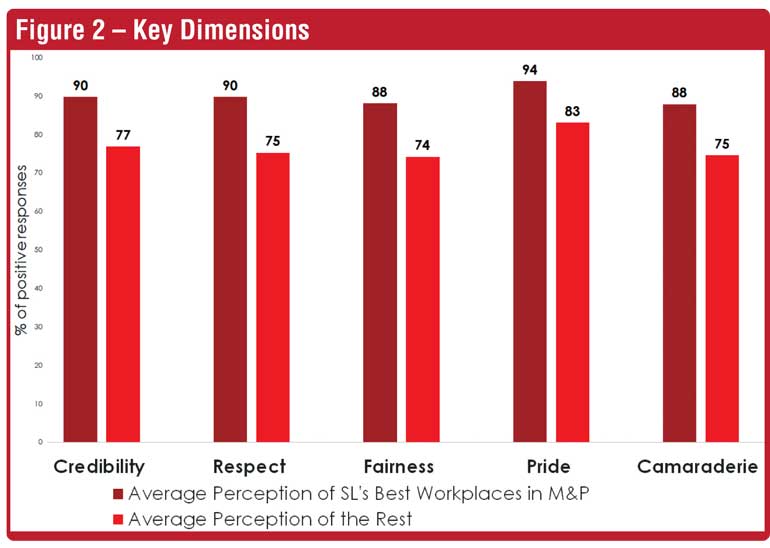
A closer inspection of key thematic areas, as per Figure 2, confirms the national trend of the highest perception being that of Pride. In fact, the margin between the Best and the Rest is also lowest in this area. The largest margin is in the areas of Respect, with Fairness a close second. The intense nature of the job and large workforce engaged in the sector could be a factor in causing the area of Respect to fall behind, therefore it is important that the sub-areas of Support, Collaboration and Care are maintained at an appropriate level. Extra effort in these areas, is giving the Best 10 an edge over the others, although the positive perception in the Rest is also above certification level.
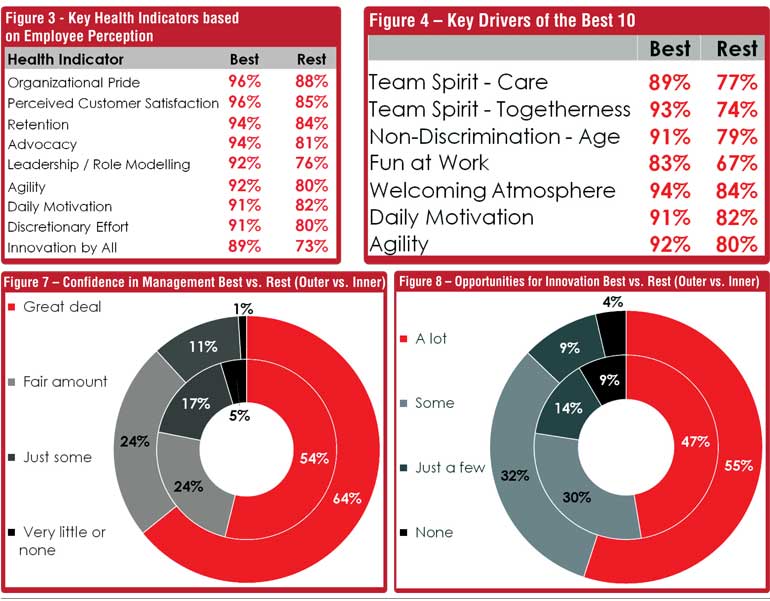
Next, we cast an eye over the Key Health Indicators in Figure 3. These are areas which are considered of paramount importance to ensure the success of the organisation. The Best 10 have very high positive perception in these areas which bodes well for overall performance, but notably steep differences can be noted in the areas of Leadership and Innovation, when compared to the Rest. This 16-point margin could easily give the Best Workplaces an advantage, especially in times of change and difficulty, as experienced recently.
In-depth insights
In any organisation, there will be certain areas of concern that are of more importance to employees than others. These ‘drivers’ may change from time to time, depending on external contributing factors, so it is important to stay vigilant and maintain awareness of employee preference. In this past year, we see that the key areas of importance to employees of the 10 Best Workplaces are related largely to Camaraderie, Fun at Work and Pride (Figure 4). Of interest is the appearance of the area of Non-Discrimination with regards to Age – a theme that has not made a notable appearance in key drivers of Best Workplace Lists of the past year. In this case, it could be attributed to the more physical aspect of some job roles in the M&P sector.
For the Rest of the organisations surveyed, a point to note is the 19% margin in the area of Togetherness of Employees, and the 16% margin and relatively lower overall perception of Fun at Work – areas to explore in terms of improvement to bridge the gap and move towards being a better workplace.
More in-depth analysis, highlights the areas of strength and those which have room for improvement in the Best Workplaces, as seen in Figure 5. Scoring in the mid-90s, these areas also have a high perception in the Rest of the surveyed organisations, even though there is a difference of 9 to 11 points. Notably, the high perception of Camaraderie is great news for these organisations, given that this area is also a key driver.
In terms of areas for improvement, the Best Workplaces maintain a high perception, which implies a good performance across the board, although the comparatively lower perception – up to 10-point difference – gives the organisations areas to work on further to maintain the high levels of employee satisfaction.
Bridging the gap
Naturally, the rest of the organisations in the industry will be looking to improve their performance and close the gap between themselves and the Best Workplaces. Figure 6 highlights the areas that the Best perform notable better than the Rest, with gaps from 16 to 19 percentage points. In addition to Team Spirit, which was mentioned before, we see that the Best are providing a greater sense of appreciation and recognising effort more effectively, as well as moving towards better compensation models through better benefits and bonus schemes. Additionally, ensuring the psychological wellbeing of employees is an area where the Rest can look to improve. 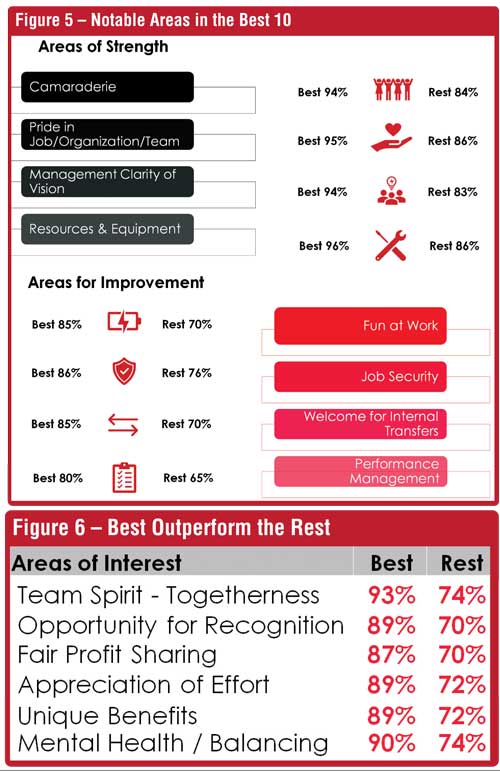
In the enhanced For All model used by Great Place to Work in the past year, special relevance is given to the areas of Leadership and Innovation – key health indicators where the Best have a notably higher level of positive perception than the Rest.
Figure 7 tabulates the confidence of employees in their management, and it’s clear that the Best have a lead, with 10% more employees answering very positively and only a fifth of employees answering negatively in comparison to the responses of the Rest.
Figure 8 notes the opportunities for innovation provided to employees in the surveyed organisations. Once again, the Best demonstrate their advantage with 87% of employees receiving a reasonable number of opportunities to innovate, compared to 77% in the Rest, with more than double the percentage of employees having no opportunity at all in the Rest.
So, we see that in this industry, the Best Workplaces have an advantage in Leadership, Innovation and Team Spirit – all areas which need to be on the ball in this era of fast-paced change, adaptation, and collaboration.
To better understand your organisation’s standing amongst your employees in general, and to be in the running for the Best Workplaces Lists of 2023, contact Kaneru Godagama on +94 774100013 and [email protected] or Great Place to Work at +94 11 454 5594 or register at www.greatplacetowork.lk.


