Thursday Mar 05, 2026
Thursday Mar 05, 2026
Thursday, 5 March 2026 00:21 - - {{hitsCtrl.values.hits}}
The simultaneous disruption of the Strait of Hormuz and renewed Red Sea threats has created an unprecedented dual-chokepoint scenario, reshaping global shipping lanes, energy markets, and trade economics. For Sri Lanka, the crisis presents certain macroeconomic challenges alongside a possible commercial opening for Colombo Port
 The dual chokepoint moment
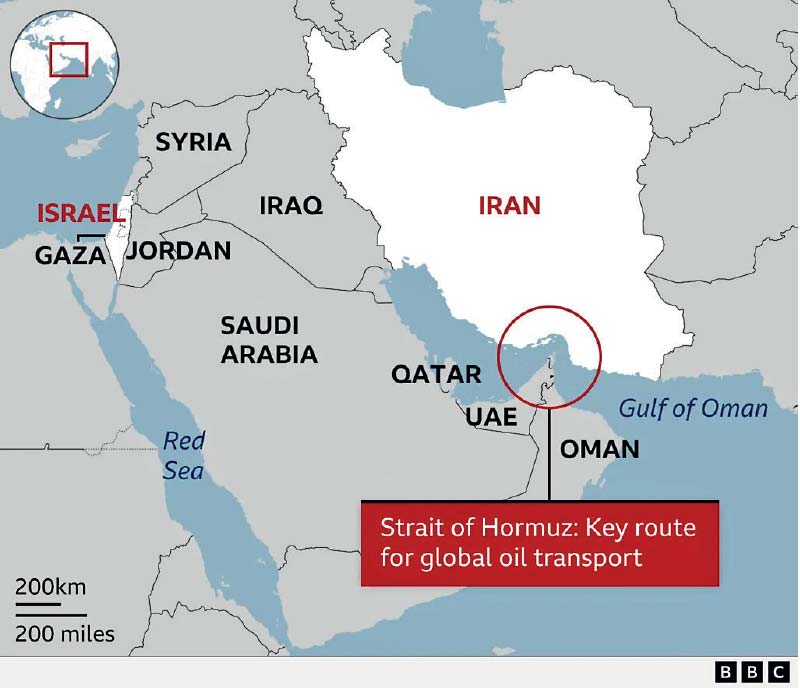
Roughly 20% of global oil supply and 20% of LNG trade flow through the Strait of Hormuz. That corridor is now, for practical purposes, closed to commercial shipping. At the same time, renewed Houthi activity has re-sealed the Red Sea lane that carriers had only recently begun to re-enter.
The strikes of February 28, 2026, and the retaliatory actions that followed, have produced a maritime situation without modern precedent: two of the world’s most critical shipping chokepoints simultaneously disrupted. By March 3, tanker traffic through the Strait had fallen approximately 86%, leaving hundreds of commercial vessels stranded or idling on either side of the chokepoint. Several leading container lines, including Maersk, MSC, CMA CGM, Hapag-Lloyd, COSCO, and ONE, are reportedly pausing transits through the Strait of Hormuz or limiting regional bookings. These broad operational adjustments may contribute to a notable and developing commercial disruption.
Energy markets: Oil moves, but gas faces sharper shock
Brent crude surged from its Friday close of $72.87 to approximately $84 per barrel by March 3, a move of roughly 15%. WTI climbed to approximately $77. The price movement, while significant, has been more measured than some analysts expected, reflecting a market still pricing in a relatively short conflict. Prediction markets put the probability of a ceasefire by June 30 at 79%.
The more dramatic shock has been in natural gas. QatarEnergy declared force majeure after drone strikes affected Ras Laffan and Mesaieed, halting LNG production responsible for roughly 20% of global supply. European Dutch TTF gas prices surged 76% to exceed EUR 60/MWh by March 3, the largest move since the 2022 energy crisis. Asia’s JKM benchmark jumped 39% to $15.07/MMBtu. Goldman Sachs noted that if Hormuz flows halt for a month, TTF and JKM could reach EUR 74/MWh, the level that triggered demand destruction in 2022.
The pre-crisis EIA forecast of $58 per barrel average Brent for 2026, published February 10, is now overtaken by events; the next Short-Term Energy Outlook on March 10 will be closely watched. Analyst scenarios have diverged. Barclays raised its Brent forecast to approximately $100 if the security environment deteriorates further. Bank of America warned a prolonged Strait disruption could add $40 to $80 to Brent, while UBS sees $120 in a material disruption case. At the measured end, Kpler’s base case sees Brent settling back to the $70 to $80 range by week’s end, assuming no further escalation.
The structural challenge is that OPEC+ spare capacity, concentrated in Saudi Arabia and the UAE, cannot reach markets if the Strait remains constrained. The V8 group agreed on March 1 to increase output by 206,000 barrels per day from April. However, as Rystad Energy observed, additional barrels do very little to ease the market if the physical corridor remains unavailable. Only about 2.6 million barrels per day of pipeline bypass capacity exists, against roughly 20 million barrels per day that normally transit the Strait.
Shipping economics: Freight, insurance, and other costs
Container freight rates had been softening through January and February. The Drewry World Container Index fell to $1,899 per FEU by February 26, its seventh consecutive weekly decline, approaching pre-Red Sea crisis levels from late 2023. That trend is now decisively reversed.
Major shipping lines are rapidly adjusting their pricing and operational models in response to the crisis. For example, CMA CGM announced an Emergency Conflict Surcharge ranging from $2,000 to $4,000 per container, effective March 2. Concurrently, Hapag-Lloyd introduced a War Risk Surcharge of $1,500 per TEU for dry cargo and up to $3,500 for reefers. MSC reportedly suspended cargo bookings worldwide to the Middle East.
Tanker markets have moved even more sharply. VLCC rates on the benchmark Middle East to China route (TD3C) reached a record $423,736 per day on March 2, nearly double Friday’s close and roughly triple the start-of-year rate. The freight cost for moving crude from the Gulf to China effectively doubled to approximately $12 per barrel.
Bunker fuel prices at Singapore, the world’s largest bunkering hub, climbed to $581 per metric tonne for VLSFO, up from $498 in mid-February. Fujairah VLSFO rose to $560 per metric tonne. These increases feed directly into vessel operating costs, which flow through to freight rates and ultimately to the landed cost of goods for importers and consumers.
Insurance dynamics
War risk premiums have risen approximately fivefold in a matter of days, with near-term hull insurance rate increases of 25% to 50% estimated for Gulf transits. At approximately 0.5% of hull value, a single Hormuz crossing now represents a war risk cost of roughly $750,000 for a large container vessel. The Lloyd’s Market Association Joint War Committee expanded its Listed Areas on March 2 to include waters around Bahrain, Djibouti, Kuwait, Oman, and Qatar. Several P&I clubs have issued notices adjusting cover terms effective March 5. The practical effect is that vessels transiting without renegotiated cover would be commercially exposed, which is a key reason most carriers have chosen to avoid the Strait altogether.
The Baltic Dry Index, at 2,083 points on March 2, has shown a more muted response so far, though spillover effects are emerging in specific trades.
Port activity and why it matters
The most consequential port-level impact is the effective disconnection of Jebel Ali, the Middle East’s dominant container hub handling 15.5 million TEU in 2024 with a Liner Shipping Connectivity Index score of 791. The port itself resumed operations after a fire from intercepted debris on February 28, but reaching it requires transiting the now-constrained Strait. Industry estimates suggest approximately 170 containerships carrying 450,000 TEU, roughly 1.4% of the global fleet, are currently positioned inside the Gulf and unable to exit.
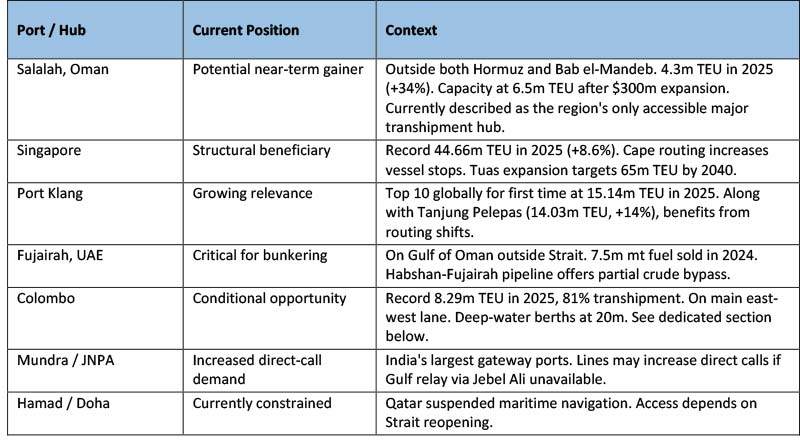
Ports located outside both chokepoints stand to see increased activity. The table below summarises the current position of key regional hubs:
For the Upper Gulf more broadly, Qatar has suspended maritime navigation, Bahrain’s Khalifa Bin Salman Port temporarily closed, and Kuwait’s Shuaiba operations were paused. ONE, the Japanese alliance carrier, suspended all new bookings to and from the Persian Gulf.
Colombo Port: A measured assessment
Colombo Port recorded a record 8.29 million TEU in 2025, with transhipment accounting for approximately 81% of volume. The Sri Lanka Ports Authority is targeting 10 million TEU in 2026, supported by the ramp-up of the Colombo West International Terminal (CWIT), which handled roughly 100,000 TEU per month by August 2025 and is bringing Phase 2 online in December 2026, lifting its capacity to 3.2 million TEU.
The Hormuz crisis creates a potential tailwind. With Jebel Ali inaccessible and carriers seeking alternative relay points for India-bound and Indian-origin cargo, Colombo’s position on the main east-west lane and its deep-water berths (20 metres at CICT and CWIT) make it a natural candidate for diverted transhipment volumes. The precedent is recent: the Red Sea disruptions of 2023 and 2024 contributed to Colombo’s 12.1% throughput surge in 2024, and bunkering demand jumped 68.2% year-on-year as rerouted vessels stopped to refuel.
Potential upside for port transhipment volumes
Should Jebel Ali face prolonged access issues lasting beyond two to four weeks, carriers might need to restructure their feeder networks for Indian subcontinent cargo. In this scenario, Colombo’s established infrastructure and berth capacity position it as a highly viable alternative. Shipping lines already visiting Colombo could potentially absorb incremental cargo volumes by increasing call frequencies or upsizing deployed vessels.
Factors that could moderate regional port gains
However, a swift resolution to these current tensions would likely mean any rerouting effects remain modest and temporary. Sustained volume shifts depend heavily on carrier strategy, as lines might prefer consolidating operations at fewer major hubs, such as Singapore or Port Klang, for logistical simplicity. Additionally, surging global fuel prices could weigh on Colombo’s bunkering competitiveness, given its reliance on imports. The broader South Asian port landscape
India’s port infrastructure continues to expand meaningfully. Vizhinjam International Seaport, inaugurated in May 2025, has had an encouraging first year, handling approximately 1.4 million containers and welcoming ultra-large vessels, including MSC Irina (24,346 TEU). Phase 2 construction began in January 2026, with a target capacity of 4.5 million TEU by 2028. Vizhinjam’s natural depth of 24 metres and its proximity to the international shipping lane position it as an important addition to the region’s transhipment capacity. Meanwhile, Mundra and JNPA continue to grow as gateway ports for Indian trade. Collectively, the expansion of port infrastructure across South Asia strengthens the region’s ability to absorb the kind of disruption now underway, providing more options for shipping lines as they redesign their networks.
Sri Lanka’s macroeconomic exposure
Sri Lanka imports virtually all its petroleum and spent $4.35 billion on fuel imports in 2024, approximately 23% of total merchandise imports. Saudi Arabia and the UAE supply a significant portion of the country’s crude.
The economy is recovering steadily but remains sensitive to external shocks. GDP grew 5% in the first nine months of 2025 before Cyclone Ditwah caused an estimated $4.1 billion in damage, prompting the IMF to adjust its 2026 growth forecast to 2.9%. Foreign exchange reserves stood at $6.7 billion in January 2026, covering approximately 3.1 months of imports, a considerable improvement from the 2022 low of $1.9 billion but still requiring careful management. The rupee traded at approximately LKR 309.75 per dollar on March 3.
The Central Bank of Sri Lanka, which held its Overnight Policy Rate at 7.75% on January 28, identified heightened geopolitical tensions as an upside risk to inflation in its January 2026 Monetary Policy Review. Headline CCPI inflation was just 1.6% in February, but the CBSL projects a gradual acceleration toward its 5% target by the second half of 2026. A sustained increase in oil prices would accelerate that timeline and could influence the scope for further monetary easing. The next policy review is scheduled for March 25.
Under the IMF’s cost-recovery fuel pricing framework, higher global oil prices pass through to domestic fuel costs, feeding into transport, agriculture, and manufacturing expenses. The fifth review of Sri Lanka’s $3 billion Extended Fund Facility, which would unlock approximately $347 million, is expected to be presented to the IMF Board for approval in March 2026. The debt restructuring is largely complete, with no foreign currency bond maturities until 2029, though the debt-to-GDP ratio remains approximately 96%.
A further consideration involves remittances. The Gulf remains a major source of Sri Lankan foreign employment and a significant dollar lifeline. Potential slowdowns in regional economic activity may impact remittance inflows.
South Asian currencies and import costs
The oil price increase amplifies existing pressures on import-dependent South Asian economies. Morgan Stanley estimates that every $10 per barrel sustained rise in oil prices affects Asia’s GDP growth by 20 to 30 basis points and widens India’s current account deficit by approximately 50 basis points. ING calculates that a 10% oil price increase raises inflation across the region’s most exposed economies by approximately 0.4 percentage points.
The Indian rupee touched 91.30 per dollar on March 2. India imports 85% to 88% of its oil needs, and roughly 50% of its crude imports transit the Strait of Hormuz according to Nomura, though the country has diversified significantly toward alternative suppliers in recent years. India’s crude and refined fuel inventory covers approximately 20 to 25 days.
Pakistan and Bangladesh face particular exposure to LNG. Kpler data shows that 99% of Pakistan’s LNG imports and 72% of Bangladesh’s come from Qatar and the UAE, both of which depend on Hormuz access. With Qatar’s LNG production halted under force majeure and no pipeline alternatives for liquefied natural gas, these economies face potential physical supply constraints, not just price effects.
For regional exporters, these cost dynamics remain worth monitoring. The textile industry, a major export driver for Bangladesh, Sri Lanka, and Pakistan, operates on tight margins. Elevated bunker fuel costs, which can account for a high share of vessel operating expenses, often influence freight rates, potentially raising the landed costs of both imports and exports. Prolonged transit times from Cape of Good Hope rerouting, adding 10 to 14 days, may tie up working capital longer, impact letter-of-credit validity, and complicate just-in-time inventory planning.
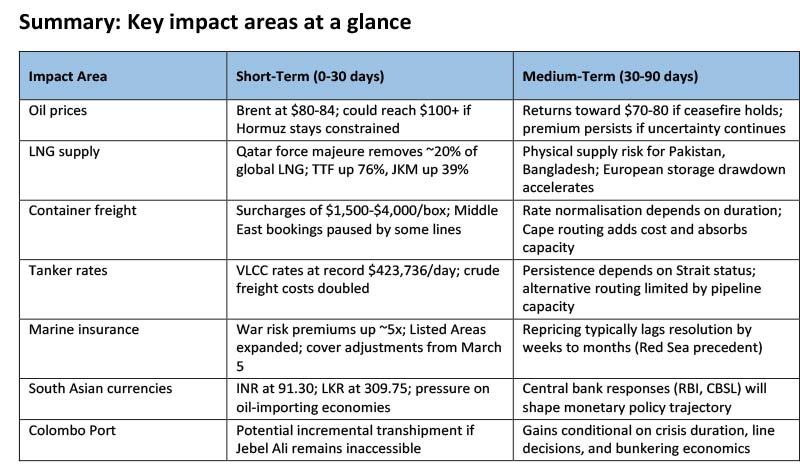
Looking ahead: The next 30 to 90 days
The commercial trajectory depends almost entirely on the duration of the conflict. In a quick de-escalation, with military action concluding within a week and a de facto ceasefire following, markets would follow a familiar pattern: a brief spike that fades within two weeks. Under this scenario, Kpler expects Brent to settle back to $70 to $80.
In an extended scenario, with sustained activity and Hormuz remaining constrained for weeks, oil moves toward $100 and beyond. European gas could reach EUR 80-100 per MWh. Rystad Energy has estimated an effective loss of 8 to 10 million barrels per day of crude oil supply due to the combination of Strait disruptions and precautionary measures. JPMorgan has noted that a conflict lasting more than three weeks would test Gulf storage capacity, potentially pushing Brent to $120.
The key distinction from past disruptions is structural. Unlike the Red Sea, where Cape of Good Hope routing is expensive but feasible, there is no viable maritime bypass for the Strait of Hormuz for the volumes involved. Pipeline alternatives cover only a third of normal flows. Analysts note that a total sustained closure remains unlikely, partly because a significant share of Iran’s own trade passes through Hormuz ports. But the de facto closure driven by insurance adjustments and carrier decisions may persist beyond any resolution of hostilities. The Red Sea offers context: Suez Canal traffic remained 60% below pre-crisis levels even after 100 days of relative calm, because carriers and insurers took time to rebuild confidence.
Conclusion
Three observations seem notable. First, the insurance and risk-pricing mechanism, rather than physical barriers alone, appears to be a major factor in redirecting traffic away from the Strait. These commercial and contractual decisions may take time to reverse as ground conditions evolve.
Second, the simultaneous disruption of Hormuz and the Red Sea positions the Cape of Good Hope as a primary corridor for most global trade, a structural constraint that could sustain elevated freight costs and transit times for an extended period.
Third, for Sri Lanka specifically, the crisis presents a dual reality: Colombo Port may gain transhipment volumes if Jebel Ali faces severe restrictions, but the macroeconomic impact of higher oil prices remains a highly consequential consideration.
The CBSL’s March 25 policy meeting and the IMF Board’s consideration of the fifth EFF review will be the next critical waypoints for assessing Sri Lanka’s position. For the logistics industry more broadly, the coming weeks will determine whether this is a sharp but contained disruption or something more structurally transformative for the Indian Ocean trade.
(The author is a Chevening Fellow from St Cross College - University of Oxford and a trade policy enthusiast)
Sources consulted


