Wednesday Feb 18, 2026
Wednesday Feb 18, 2026
Wednesday, 30 January 2019 00:10 - - {{hitsCtrl.values.hits}}
FTAs and Sri Lanka’s trade performance
This section begins with a stage-setting discussion of the relative importance of supply-side and demand-side factors for Sri Lanka’s export performance and the compatibility of Sri Lankan trade patterns with that of the existing and potential FTA partners. This is followed by a preliminary assessment of the trade outcome of SLIFTA and SLPFTA.
Supply and demand in export expansion
Perhaps the best readily available indicator of the relative importance of demand and supply factors in determining a country’s export performance is its share in total world exports. A continuous decline in the world market share implies that the country has not been able to exploit existing world market opportunities because of supply constraints. If that is the case, market opening by signing FTAs is unlikely to have an appreciable effect on export expansion.
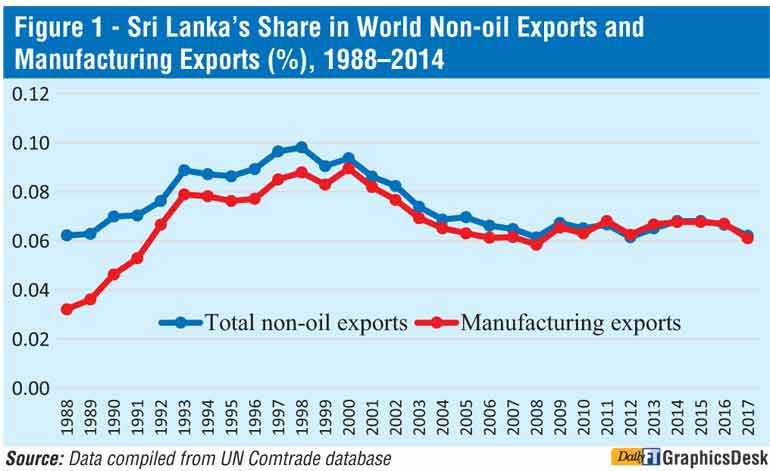
Figure 1 depicts Sri Lanka’s share of world exports separately for total exports (excluding petroleum) and manufactured goods. Sri Lanka’s share in world exports increased from 0.05% in the mid-1980s to about 0.11% in 2000, underpinned by significant trade and FDI reforms undertaken concurrently during this period. It has then declined continuously, reverting to the level in the 1980s by 2017.
The time patterns of both data series are strikingly similar. This suggests that slowing of the export growth of both primary products and manufactured goods during the last two decades has been driven primarily by domestic supply-side factors. Exports from the country has failed to keep up with the expansion of world demand. Policy slippages on the supply side, rather than failure to join the FTA-club was the fundamental reason behind this lacklustre export record (Athukorala 2019).
The data presented in Table 1 on Sri Lanka’s exports to the European Union and the utilisation rates of GSP concessions reinforce the inference made above. In fact, GSP utilisation rate is a much better indicator of the relative importance of supply-side factors relating to the FTA debate: In terms of facilitating export expansion through concessionary market entry, a GSP scheme is similar to an FTA even though the underlying modalities are different. 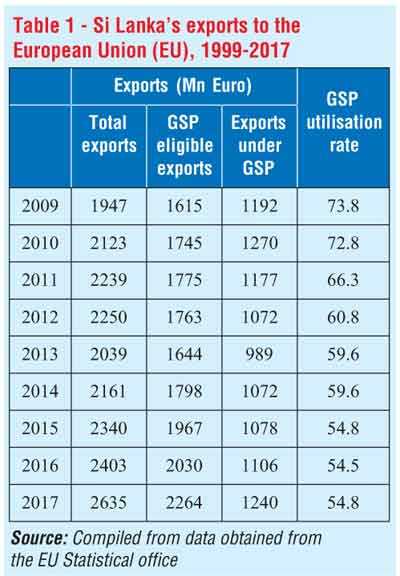
The GSP utilisation rate in exports to the EU has declined sharply from about 73.8 in 2009 to 54.8 in 2017 with only minor year-to-year changes, The country-level GSP utilisation data for the same data source (not reported here for brevity) suggest that Sri Lanka’s average utilization rate is lower than all GSP-eligible countries in Asia and even most GSP-eligible African countries. Data are not yet available to assess the impact of the recent reintroduction of GSP+.
Trade compatibility
The trade compatibility index estimated for Sri Lankan’s import and export with India, Pakistan, Singapore and a sample of other countries during 2015-17 are reported in Table 2. Three-year averages are used here in order to reduce the influence of any annual irregular variation in trade data. A high coefficient of compatibility on the export side implies that an FTA between Sri Lanka and an importing country would have a high likelihood of increasing exports from the former to the latter. Likewise, high coefficient of compatibility on the import side implies that an FTA with a given country has a high likelihood of increasing imports to Sri Lanka from that country.
It is important to note that this index provides for only an ordinal inference: we can infer from it only whether one agreement make more sense than other from the point of view of a given country. The index cannot yield an inference of cardinal nature, such as the expected size of trade, or trade creation or trade diversion following one agreement or another no, for that matter, will they tell whether the agreement is expected to be ‘good’ or ‘bad’ (Michaely 1996).
The value of the index is significantly larger for both export and imports with developed countries (USA, Germany and UK) compared to countries in the region, which are the focus of current FTA negotiations in Sri Lanka. This contrast is consistent with the available evidence that trade gains for developing countries from their FTAs with developed countries (South-North agreements) is likely to be greater compared to those among developing countries (South-South agreements) (Stevens et al 2015).
Sri Lanka’s trade compatibility with India on the exports side is much smaller (0.21) compared to that on the import side (0.68). These is no notable difference between the export complementarity index and imports complementarity index relating to Pakistan, and the latter is much smaller (0.35) compared to that with India (0.68). As we will see below Sri Lanka’s trade patterns under the FTAs with these two countries are broadly consistent with one would expect based on trade compatibility indices. The indices also suggest that, under the existing trade patterns, we cannot expect much export expansion from FTAs with Singapore, Thailand or China.
Sri Lanka-India Free Trade Agreement (SLIFTA)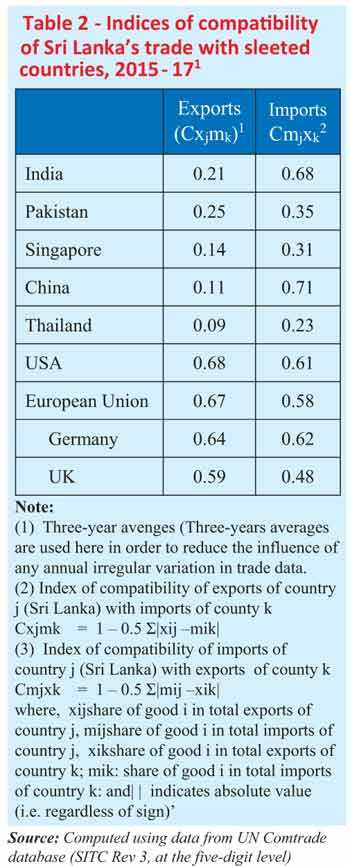
The SLIFTA was signed in December 1998 and it became operational in March 2000. The agreement covers only merchandise trade (traded goods). In 2005, Sri Lanka and India initiated negotiations to extend the SLFTA into a Comprehensive Economic Partnership Agreement (CEPA), which would cover services and investment in addition to broadening commodity coverage of trade liberalisation.
The SLIFTA adopts a negative list approach to trade liberalisation. To begin with India-Sri Lanka FTA (ISLFTA), India provided Sri Lanka duty concessions (90-100% duty exemptions) on 1351 items (at the six-digit level of the Harmonised System). However, tea and garments produced with non-Indian fabrics were subject to import quotas and could enter India only through designated ports. In early 2003, 2,799 more items were added to the concession list, port-of-entry restrictions on tea and garments were relaxed and the quota on garment imports was expanded.
Trade preferences granted by Sri Lanka to India are more extensive and larger in proportional terms, but concessions have been granted mostly on products for which MFN tariffs are already very low. Most of food products exported from India, which have considerable potential for rapid market penetration in Sri Lanka, remain on the negative list with high import duties.
The RoOs of the agreement are a combination of RVC and CTS: value added 35% of FOB value if the inputs come from both countries or 25% if inputs conform one of the two countries; final product have a different classification compared to intermediate inputs at the four-digit HS level. The agreement incorporates special and differential treatment provisions to factor in Sri Lanka’s smaller economic size (Kelegama 2014, Weerakoon 2001).
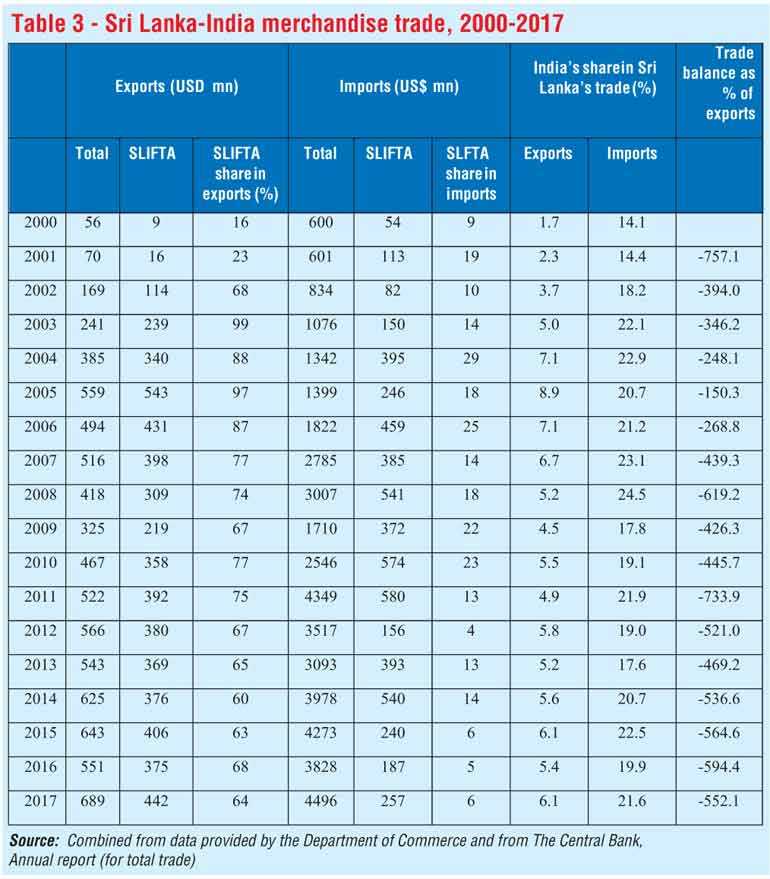
A claim made in various government reports and by proponents of FTA is that Sri Lanka has been a net gainer of the SLIFTA: exports under the agreement account for over 60% of total exports to India whereas only a smaller share of import (about 10%) is covered by the agreement (Central Bank of Sri Lanka 2018, Ratnayake 2017). However, a close look at the data suggests that this is a rather simplistic interpretation of the actual trade outcome under the agreement (Table 2).
There was a surge of exports from Sri Lanka to India during the first seven to eight years following the agreement came into force. This was mainly due to exports of Vanaspati (refined hydrogenated oil, listed under HS 151620) and primary copper (extracted from imported from scrap metal)(HS7403). These products accounted for over nearly 60% of total Sri Lankan export to India during this period. However, the expansion of these exports was not driven by Sri Lanka’s comparative advantage in their production compared to India. Rather, it was because Indian manufacturers invested heavily in Sri Lanka to produce these products to reap gains from lower Sri Lankan tariffs on required main inputs (crude palm oil for Vanaspati production and scrap metal for extracting primary copper)and preferential (under zero tariff) entry of the end products to India under the FTA (Athukorala 2014).
The export dynamism of Vanaspati and copper was short-lived, however. Under strong pressure from the Indian Vanaspati Producers Association, India subsequently cut its import tariffs on palm oil from 70% in the early 1990s to 7.5% in January 2008 and then to zero in March 2008and imposed stringent tariff rate quotas on Vanaspati imports from Sri Lanka. Consequently, Vanaspati exports disappeared from Sri Lanka’s export list from about 2009.
In the case of copper, from 2008 India begun to regulate imports from Sri Lanka based on its own domestic value addition estimates made using the London Metal Exchange prices. This remarkable policy response was based on India’s concerns about the validity of the RoO certificates issued by the Sri Lankan Department of Commerce. Following the introduction of the stringent procedure for approving market access, a large proportion of Sri Lankan copper exports Lanka became ineligible for entering India under the FTA tariff concessions.
During the ensuing years, Sri Lankan exports to India of some other products were also subject form time to time various forms of ‘administrative protection’ such as stringent food safety regulations, delaying Customs clearance and changes made in the list of ports demarcated for the entry of Sri Lanka goods (Pal 2015). There is also anecdotal evidence that some Sri Lanka exporters have begun to shun the FTA and export under the MFN tariffs because of the cumbersome and costly procedures involved in obtaining RoO certificates and delays in import clearance at the Indian ports.
Reflecting the combined effect of all these factors, the share of Sri Lanka’s exports to India covered by the SLIFTA declined from a peak of 97% in 2005 to about 64% during the past five years. The share of total exports to India declined from about 8.5% in the early 2000s to 6.4% during 2015-17. Even these figures need to be treated with caution because of some cases of alleged ‘trade deflection’ (that is, rerouting some products) of some products from other countries to India via Sri Lank through alleged manipulation of the country of origin certification. Two highly-publicised cases are rerouting to India of areca nuts from Indonesia and black pepper from Vietnam.
The food safety regulations and other administrative restrictions imposed by India on imports from Sri Lanka from time to time clearly support the view that, in practice, implementation of a bilateral FTA is highly susceptible to domestic lobby group pressures, particularly when the FTA partner is a large country with greater bargaining power. Presumably, a small country like Sri Lanka has a much better chance of resolving these issues through the multilateral dispute settlement process of the WTO. Involvement of other WTO members is the dispute settlement process could help overcome resistance arising at the bilateral level.
An interesting example is the resolution of the Sri Lanka– EU dispute relating to cinnamon exports (https://www.wto.org/english/news_e/news06_e/sps_oct06_e.htm). In 2006, some member countries of the EU introduced a de-facto banned on imports of cinnamon from Sri Lanka because of sulphur dioxide (SO2) content. Sri Lankan authorities were able to successfully resolve the dispute by appealing to the WTO under the Sanitary and Phytosanitary (Animal and Plant Health) agreement. The settlement of the issue involved adoption of a new international food safety standard for cinnamon that helped ensuring transference in food safety monitoring in international cinnamon trade.
It is often claimed that, under the SLIFTA, India has become the second largest destination for Sri Lankan exports. However, India accounts for only about 6% of Sri Lankan exports compared to the 26% share of the largest destination country, the USA. A close look at the commodity composition of exports casts doubt about possibilities for further expansion of exports from Sri Lanka to India.
Most of the agricultural products, which account for the bulk of total exports to India, are subject to supply constraints. Sri Lanka’s total (world) exports of some agricultural products (cinnamon, cloves, black pepper) have increased at a much slower rates or even hardly increased, suggesting that increase in exports to India involved diversion of exports from other markets propelled by duty free market access rather than by a net increase in domestic production. Most of the manufactured goods exported from Sri Lanka under the FTA benefit from high MFN import tariffs in India, and are, therefore, susceptible to further unilateral trade liberalisation in India. Garments, the main manufacturing export of Sri Lanka, account for less than 3% of Sri Lankan exports to India.
 Imports under SLIFTA account for a small and declining share in Sri Lanka’s total imports from India. During 2000-17 the average annual share was a mere 6.1%. This pattern is consistent with Sri Lanka’s high trade compatibility with India on the import side (Table 2). The high compatibility is in fact what we would expect in trade between a small country and a giant trading pattern with a highly diversified production base. India has a large and diversified production base compared to Sri Lanka and most of the products in Sri Lanka’s import baskets are produced in India at internationally competitive prices. Moreover, Sri Lanka is a low-tariff country in the region with significant number of zero-duty tariff lines.
There was a notable decline in Sri Lanka’s bilateral trade deficit with India during about the first five years following the SLIFTA came into effect. This declining trend has disappeared since then. Over the past decade, the bilateral trade deficit amounted to over five times of total exports to India without showing any declining trend.
Given the glaring asymmetry on export and import sides between Sri Lanka and India under the SLIFTA, India has an exorbitant bargaining power in trade negotiation with Sri Lanka. This arguably accounts for India’s ability to control imports from Sri Lanka by resorting to various non-tariff barriers (Pal 2015), notwithstanding its stated commitment to honour special and differential treatment provisions. The experience so far under the SLIFTA, therefore, does not augur well for Sri Lanka to obtain further market access through the ongoing ETCA negotiations.
Sri Lanka-Pakistan Free Trade Agreement (SLPFTA)
The SLPTFA was signed in July 2002 and it came to effect in June 2005. In terms of the coverage of the concessions (‘positive’) list and the RoOs the agreement is virtually a mirror image of the ISLINDFA (Ahmad 2012).
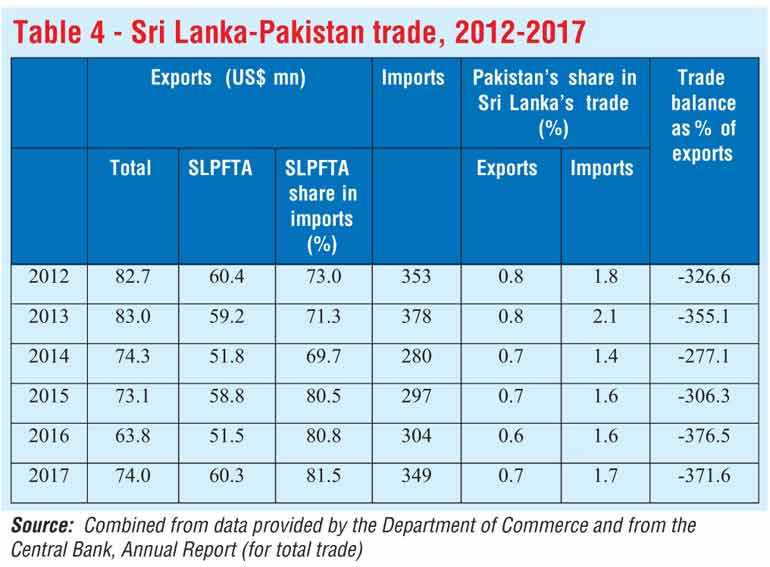
SLPFTA covers about 80% of total Sri Lankan exports to Pakistan, but these exports account for a mere 0.7% of total Sri Lankan exports. The export mix is dominated by agricultural products and ago-based raw material: natural rubber, vegetable products, coconut and some spices. The data for the past five years shows that the average utilisation of TRQs offered has been very low: tea 13%; garments 4%; betel leaves: 6%. For tea and garments, higher prices of Sri Lankan products compared to imports from other sources are considered a major reason for the low quota utilisation. Sri Lankan garment producers have significantly upgraded their product mix over the past few decades and Pakistan is not attractive market for these products (PBC 2018).
Imports from Pakistan account for about 1.7% of total Sri Lankan imports. The product mix consists of woollen fabrics and bed linen, cements, fertiliser, and basmati rice. There is no evidence of a notable increase in imports following the FTA coming into effect.
At the time of negotiating the agreement, the Sri Lankan authorities expected that the country’s garment industry would benefit from procuring cotton yarn and fabrics from Pakistan (World Bank 2005). This expectation has not materialised: Pakistani yarn and fabric accounts for a small share (less than 2%) of these imports to Sri Lanka. This was presumably because garment producers must procure high quality inputs from established sources to meet the quality requirements demanded by the international buyers. Moreover, garment producers in Sri Lanka have duty free access to imports from any country under the FTZ scheme and duty rebate provisions available to non-FTZ firms.
Overall, trade patterns under the SLPFTA are consistent with our analytical prior that trade outcome under an FTA depends crucially on the trade compatibility between the partner countries. Of course lack of awareness among the business community of the trade concessions offered in the agreement, as noted in a recent study by the Pakistan Business Council (PBC 2015), could have played a role at the margin.
(Athukorala is Professor of Economics, Australian National University, and can be reached via [email protected]. Silva is former Ambassador and Permanent Representative to WTO and former Deputy Head UN-ESCAP New Delhi Office and can be reached via [email protected]. Silva’s contribution to the article comprise his own views and do not reflect the organisation that he is currently affiliated with. The full article with references is available on request from: [email protected].)

The Sri Lankan FTA debate: Substance and semantics: Part 1
The Sri Lankan FTA debate: Substance and semantics: Final Part


