Thursday Oct 22, 2026
Thursday Oct 22, 2026
Thursday, 28 May 2026 00:45 - - {{hitsCtrl.values.hits}}
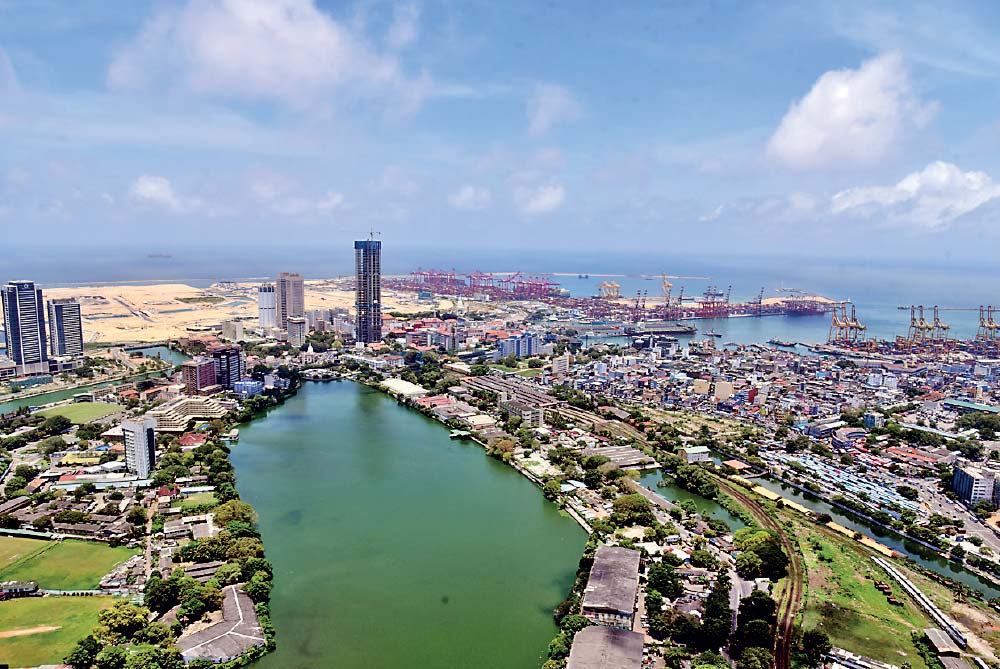
 The global economic architecture of 2026 is defined by starkly different developmental choices made over the last century. At the time of their independence, nations like Sri Lanka held immense promise, outperforming major regional peers. Decades later, structural choices have propelled China into a manufacturing and technology titan, left the United States defending its consumption-heavy economic model, and forced Sri Lanka into a rigorous cycle of macroeconomic recovery.
By analysing the foundations of these economies, the historical turning points of 1990, the educational and industrial strategies that altered the global balance of power, and the state of play in 2026, we can map the anatomy of modern economic development.
Sri Lanka’s post-independence promise
Upon gaining independence in 1948, Sri Lanka (then Ceylon) boasted one of the most prosperous economies in Asia. Based on nominal GDP per capita, Sri Lanka was widely considered the third richest country in Asia, trailing only behind an industrialising Japan and a commodity-rich Malaysia.
The lost momentum
At independence, Sri Lanka had a GDP size under $1 billion, but it possessed robust foreign reserves, low public debt, and highly favorable terms of trade driven by agricultural exports like tea, rubber, and coconut. However, failure to structurally transform the economy away from raw commodities and toward high-value industrial sectors, combined with rising import dependencies and a rapidly expanding civil service, gradually eroded this initial wealth. Over the subsequent decades, high-growth engines like Singapore and South Korea bypassed Sri Lanka, offering a stark lesson in the dangers of stagnant economic structures.
A four-nation comparative review
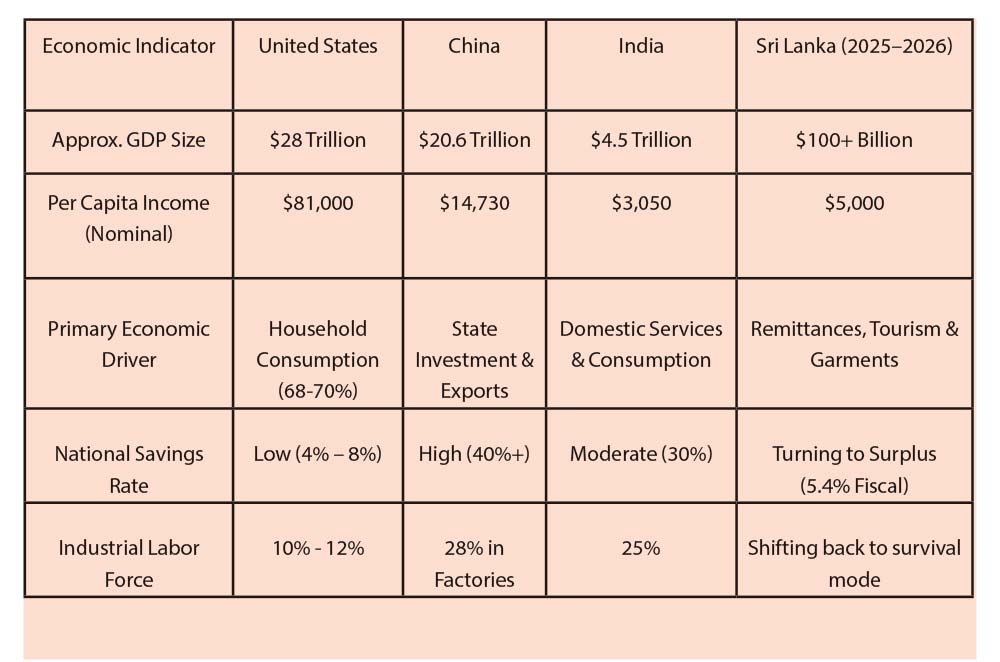
To understand the scale of divergence, a structural comparison of the United States, China, India, and Sri Lanka illustrates the variance in economic size, spending patterns, and workforce dynamics:
India and China (1990 vs. 2026)
In 1990, India and China stood at an identical economic baseline. In fact, World Bank data shows that in 1990, their per capita GDPs were virtually at parity, with India slightly ahead at $364 compared to China’s $348.
India: ███████████████ $364
China: █████████████ $348
India: ██ $3,051
China: ████████████████████████████$14,730
Over the next 35 years, China systematically outpaced India through a massive structural migration, shifting its labor force from farming to non-farming systems. By systematically moving millions of agricultural laborers into factory settings, China built an industrial base where 28% of its total labor force works directly in factories.
The vanguard of the green transition
This industrial engine has allowed China to move from basic assembly to pioneering global technology. In 2026, China stands as the undisputed global leader in Electric Vehicles (EVs) and advanced lithium-ion batteries. Companies like BYD and CATL control the majority of the global clean energy supply chain, turning green tech into a major macroeconomic pillar.
China’s institutional and educational leadership
China’s transition from a low-income agrarian state to a technological superpower was orchestrated by an institutional focus on capacity building, high-quality public education, and state-directed research.
Educational system refinement
Unlike many developing nations where quality education is localised within expensive private institutions, Beijing heavily regulates and standardised the Government school and college system. By injecting state funds into public education, they minimised regional disparities and instituted rigorous, merit-based testing frameworks.
Research quality and academic standing
The quality of academic research within Chinese universities has surged exponentially. In terms of global science and technology index citations, patent applications, and international university standings, China’s top-tier institutions now output high-impact research papers at a volume five times greater than India. This systematic investment in STEM (Science, Technology, Engineering, and Math) created the highly skilled engineering workforce required to sustain its advanced manufacturing sectors.
United States vs. China
The global economic landscape remains anchored by these two giants, who together command over 40% of global nominal GDP. However, their internal financial dynamics are highly polarised.
Savings mindsets
The cultural divergence is evident in domestic savings. While Americans heavily rely on sophisticated consumer debt instruments, maintaining a low personal savings rate of 4% to 8%, Chinese citizens maintain a precautionary national savings rate exceeding 40%. This serves as a vital financial buffer against a thin public social safety net for healthcare and pensions.
US-China Beijing Presidential Summit
In mid-2026, U.S. President Donald Trump and Chinese President Xi Jinping convened a high-stakes summit in Beijing. Occurring six months after the October 2025 “Busan truce”—which temporarily de-escalated a bitter trade war by dropping U.S. tariffs from 57% to 47%—the meeting underscored a transition toward a pragmatic “managed rivalry.”
Key commercial outcomes vs. reality
Deep-seated geopolitical issues remained at a stalemate. President Xi issued a sharp warning regarding U.S. policy toward Taiwan following Washington’s approval of an $11 billion arms package. Concurrently, no binding accords were reached regarding energy infrastructure disruptions in the Middle East or maritime oil sanctions involving Iran, as Beijing prioritised its strategic energy supply channels.
Sri Lanka’s macroeconomic recovery (2025–2026)
While global superpowers negotiate a complex strategic stalemate, Sri Lanka is executing a significant post-crisis economic recovery, successfully bouncing back from its devastating 2022 default baseline. During the peak of that crisis, the nation faced a brutal 7.3% economic contraction and hyperinflation that maxed out at an unprecedented 70% in September 2022. Decades of deep-seated structural imbalances had historically left the country dependent on 16 previous IMF programs, culminating in a near-total collapse where the revenue-to-GDP ratio dropped to an unsustainable 8.5%.
However, by late 2025 and into 2026, aggressive stabilisation policies engineered a remarkable macroeconomic turnaround. The total economy crossed the $100 billion milestone for the first time in history in 2025, pushing nominal per capita GDP past $5,000. This expansion was anchored by a monumental fiscal transformation, which saw the primary fiscal balance shift from a staggering 5.7% deficit in 2021 to a remarkable 5.4% surplus by 2025.
This newly found stability is further reinforced by robust external and internal buffers. Gross official reserves were successfully rebuilt to $6.8 billion entirely through strategic market purchases. Concurrently, the Government accumulated liquid cash buffers exceeding Rs. 1 trillion in state banks, allowing the island nation to absorb external shocks without relying on new borrowing. This disciplined approach has yielded critical debt and currency stability; central Government debt has declined to approximately 92% of GDP, while the Sri Lankan Rupee (LKR) stabilised dramatically, experiencing a minor depreciation of just 3.6% against the US Dollar in early 2026—a massive recovery compared to its catastrophic 44.8% crash in 2022.
Despite these significant macroeconomic milestones, businesses on the ground continue to operate in a highly cautious and restrictive environment. The structural recovery remains a work in progress, anchored by the ongoing $3 billion IMF Extended Fund Facility (EFF). While $1.7 billion of this crucial facility has been successfully disbursed to stabilise the economy, full optimisation depends on the future, as approvals for the vital 5th and 6th tranches remain pending.
On the microeconomic level, local industrial sectors are grappling with three immediate, severe headwinds that complicate the path from stabilisation to growth. First, enterprise strategy has shifted entirely toward survival over expansion. Exporters, in particular, are freezing capacity-building plans to prioritise daily operational survival, hit hard by escalating utility rates, high local fuel prices, and surging marine insurance costs driven by ongoing shipping disruptions in the Middle East.
Second, a deep sense of monetary caution permeates the financial sector. Domestic consumer inflation recently delivered a sharp wake-up call, ticking up from a stable 2.2% to 5.4% within a single month. This sudden spike validates the Central Bank’s highly measured, conservative approach to monetary easing and resistance to premature stimulus, keeping borrowing costs higher for longer for struggling enterprises.
Finally, severe national grid infrastructure constraints are actively choking the green transition. While private and public interest in renewable energy is high, solar power expansion is heavily bottlenecked. The country’s power grid suffers from a critical lack of commercial power storage capacity, meaning that during peak daytime generation, vast amounts of clean energy simply cannot be absorbed or saved, leaving industries tied to expensive, traditional power sources.
(The author is a researcher in the legislative sector, specialising in policy analysis and economic research. He is currently pursuing a PhD in Economics at the University of Colombo, with a research focus on governance, development, and sustainable growth. He holds a Bachelor of Arts in Economics (Honours) from the University of Jaffna and a Master’s degree in Economics from the University of Colombo. His academic background is further strengthened by postgraduate diplomas in Education from the Open University of Sri Lanka and in Monitoring and Evaluation from the University of Sri Jayewardenepura. He could be reached via email [email protected])