Thursday Mar 26, 2026
Thursday Mar 26, 2026
Friday, 13 March 2026 00:14 - - {{hitsCtrl.values.hits}}
 When we think of customers, we imagine people who purchase or use products or services. However, customers are not the only people who interact with goods and services at the buying stage.
In business, there are two types of customers: internal and external customers. Internal customers are the employees of a business who exchange their time and services for remuneration paid by an employer. External customers buy a product or service in exchange for a price. Both these customers are very critical for the success of a business. Internal customer satisfaction and loyalty influence the creation of satisfied and loyal external customers, and, in turn, a profitable business. Service-Fit Chain is a business theory introduced in 1994 in the Harvard Business Review by Leonard Schlesinger, W. Earl Sasser, and James L. Heskett, which strongly establishes the linkage between internal customers’ satisfaction and external customers’ satisfaction, loyalty, and business profitability.
Businesses do take customer satisfaction seriously, and many set customer satisfaction and loyalty as business KPIs (Key Performance Indicators). However, according to past research, many companies focus primarily on external customer satisfaction rather than on internal customers, even though both internal (employees) and external customers (customers) are crucial to business growth as described in the Service-Fit Chain theory. While it is curious why businesses do not focus much on employee satisfaction, this article examines the complexity of measuring customer satisfaction and loyalty, and their relationship.
The companies that measure customer satisfaction and loyalty use different models and measuring tools. Among them, a widely used measurement tool is the Net Promoter Score, known in the business and research communities as NPS studies. NPS was introduced by Fred Reichheld in 2003 in his article “The One Number You Need to Grow” in the Harvard Business Review. NPS measures loyalty using an 11-point recommendation scale, ranging from 0 (do not recommend) to 10 (extremely recommend).
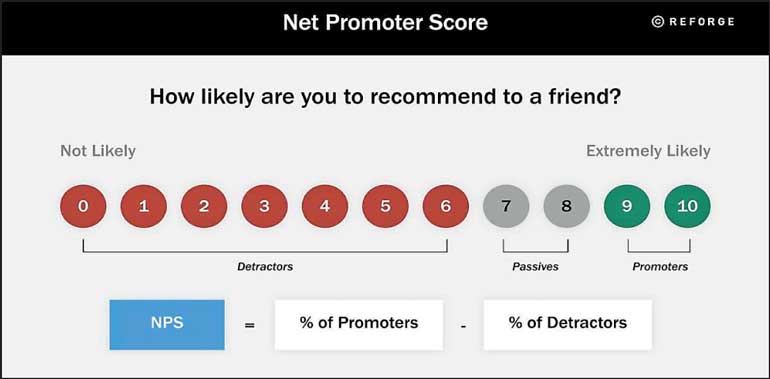
For those who don’t know much about this, let me explain. The scale would be presented as below, and ask customers, ‘On a scale from 0 to 10, how likely are you to recommend [Company/Product/Service] to a friend or colleague?’ in an unbiased manner (Meaning, in a scientifically designed study, by an independent party from the business).
Based on customer responses, the NPS score is calculated by subtracting the percentage of customers who said very unlikely or unlikely (detractors) from those who said very likely (promoters).
 This is one of the simplest ways to measure customer loyalty: easy to track, a useful high-level business health measure, and simple to understand. Hence, there is a growing trend to use NPS as a measure of customer loyalty, and empirical research is increasingly debating its proper use and interpretation.
Among the arguments on NPS usage, the most important to note is that businesses tend to simply measure NPS using one single question when loyalty should consider multiple dimensions, such as attitudinal loyalty (e.g. Preference, commitment) and behavioural loyalty (e.g. Repeat purchase, spend more of the wallet, increase frequency of purchase, etc). The next biggest argument is that it ignores the customer who chooses 8/9 on the scale, which is labelled ‘passive’, and is not represented in the loyalty measurement.
To make the best use and increase the power of interpretation of NPS, much past research has suggested using NPS in customer satisfaction (CSAT) studies and compare it with other specific experience elements that demonstrate behavioural aspect of loyalty such as recommendation on speed of the service, quality of the product/service, product availability etc.. so that more evidence increases the explanation power, statistical analysis and hence use the study data more meaningfully and purposefully for business decision making.
Having CSAT and NPS in the same study enables analysing customer recommendations through the lens of satisfaction, thereby explaining their complex relationship in a simpler, more actionable manner. For example, the data show that although satisfaction and recommendation show a healthy positive correlation, some customers are not happy but still recommend, while others who are happy do not recommend.
There are many reasons and contexts in which customer satisfaction and recommendations would not behave in a linear, positive manner. Among these reasons, the fundamental differences in the satisfaction and recommendation constructs themselves are the main reason, followed by other factors such as cultural aspects, the nature of the industry, brand status in the market, customer profiles, and generational impacts.
Satisfaction is an evaluation of what is being experienced and is short-term, whereas the recommendation is an emotional, long-term, and intentional outcome, fuelled by many other factors, such as cultural, demographic, and psychographic factors, the emotional connection the brand has created with customers, and more.
For example, people in a collective culture like Asia, although satisfied, would hesitate to recommend, as they feel responsible for their recommendations. They feel irresponsible if the recommendation of certain brands of products or services did not work for someone else at the same level it had worked for them. Simply because a particular customer might have been treated well at a hotel and very satisfied, but they would not be sure how it would work for another person, because the other person’s expectations would not be similar, and they would refrain from recommending, to avoid any possible bad reflection on them.
Therefore, the relationship between satisfaction and recommendation would differ depending on the nature of the product or service being referred. For example, there could be a strong relationship between customer satisfaction and recommendations at a retail store, given the transactional nature of the interaction, compared to a hospital or a bank, where recommendations involve more rational thinking and take into account many technical and service aspects, more than pure self-satisfaction, hence moderate level of relationship can be found between customer satisfaction and recommendation.
Another example is that if a particular brand is a monopoly, satisfaction will not play a major role in recommendations due to limited market options, whereas a niche brand recommendation would be shaped by many other factors, such as exclusivity, brand identity, etc., more than satisfaction. A brand with vast availability would be recommended even if customers are moderately satisfied.
While there are many other examples and situations where the linear relationship between customer satisfaction and recommendation will not follow the same expected pattern, another critical aspect is the demographic and psychographic profile of the customers being targeted. For example, differences in customer expectations between male and female customers, between digitally savvy and traditional customers, between young and old customers, and in buying power would impact how satisfaction translates into recommendations.
Therefore, having some unusual patterns between customer satisfaction and recommendations may be real; do not try to remove or clean them, thinking they are outliers in the data set, as a typical quantitative researcher would. If such data are carefully investigated and properly interpreted with further analysis to better understand such segments, and triangulated with qualitative data, enabling further validation and interpretation.
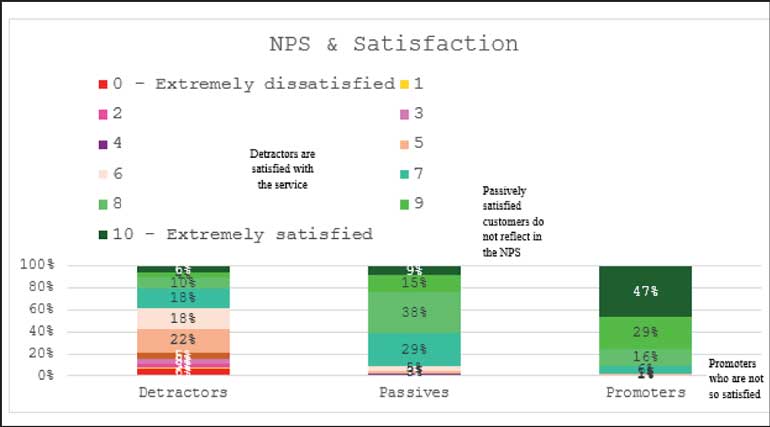
Above all, when NPS is used to measure customer recommendations, it adds another layer of complexity because of how NPS is calculated. As mentioned above, NPS disregards the passive segment, which rates 7/8 on an 11-point recommendation scale. The data presented below, from a case study that measured satisfaction and recommendations using the same 11-point scale, demonstrate that some who are treated as detractors in the NPS tool are satisfied, with nearly 38% rating 7/8/9/10 on the satisfaction scale.
On the other hand, nearly 90% of passive customers are quite satisfied and rate 7/8/9/10, which would exclude them from the NPS calculation. Finally, some of the promoters (e.g., 2%) seem dissatisfied and rated below 6 on the satisfaction scale, which may be considered outliers unless clearly justified.
To simplify the complexities of CSAT and NPS, the best recommendation is to adopt a mixed-methods approach using both qualitative and quantitative methods for CSAT and NPS studies, and to use multidimensional NPS measures rather than unidimensional ones, thereby enhancing the explanatory power of the data and making it more action-oriented for businesses and simple for researchers’ interpretation.
(The author is the CEO/Executive Director of Survey Research Lanka Ltd, a full-service research and consultancy company established in 1989)

