Friday Jul 17, 2026
Friday Jul 17, 2026
Thursday, 21 May 2026 15:10 - - {{hitsCtrl.values.hits}}
By Ceylon Tea Brokers PLC
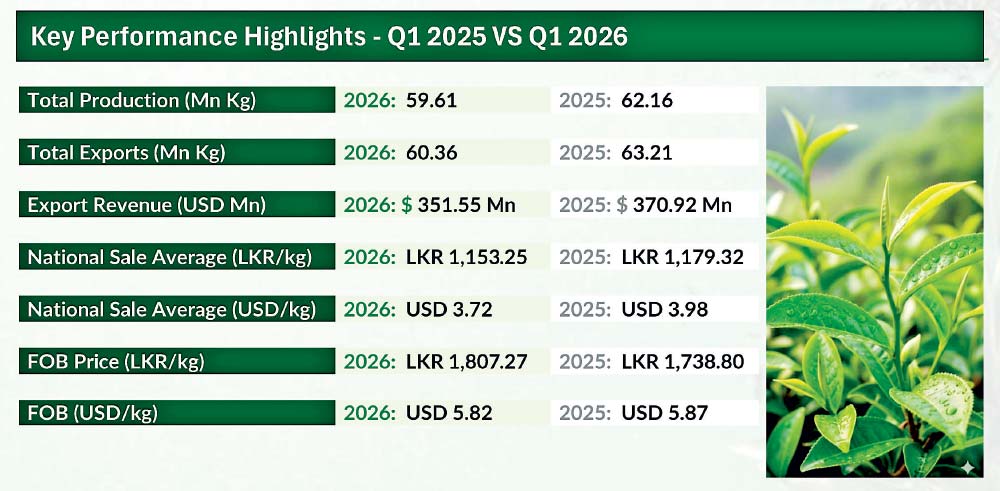
During the first quarter of 2026, Sri Lanka’s tea industry recorded declines across Production, Export volumes, and National Tea Sale Average Price compared to the same period in 2025. Total tea production dropped by 2.55 million kilograms, falling from 62.16 million kilograms in 2025 to 59.61 million kilograms in 2026. Total exports also declined by 2.85 million kilograms, decreasing from 63.21 million kilograms to 60.36 million kilograms. Meanwhile, the national sale average at the Colombo Tea Auction dropped by Rs. 26.07 per kilogram, from Rs. 1,179.32 in 2025 to Rs. 1,153.25 in 2026.
In terms of export destinations, Iraq continued to be the largest importer of Ceylon Tea during Q1 2026. Turkey demonstrated a significant increase in demand, with imports nearly doubling compared to the previous year. Conversely, markets such as Russia, the United Arab Emirates, Libya, and Iran registered noticeable declines. FOB prices, when measured in Sri Lankan Rupees, showed year-on-year improvement across all three months of the quarter, largely reflecting the currency depreciation. However, FOB values in $terms remained under slight pressure throughout the period.
The total tea production for the period January to March 2026 recorded a decline when compared with the corresponding period in 2025, reflecting a reduction across all elevations. Total tea production decreased by 2.55 million kilograms, falling to 59.62 million kilograms in 2026 from 62.16 million kilograms in 2025.
High Grown teas recorded a marginal decrease of 0.40 million kilograms, totaling 13.48 million kilograms in Q1 2026 compared to 13.89 million kilograms in Q1 2025. Medium Grown teas experienced a more notable reduction, declining by 0.96 million kilograms to 10.16 million kilograms from 11.13 million kilograms recorded in the previous year.
Low Grown teas, which continue to account for the largest share with 60.33% of national production, also recorded the most significant decline. Production fell by 1.18 million kilograms, decreasing to 35.97 million kilograms in 2026 from 37.15 million kilograms in 2025.
The overall decline in production across all three elevations indicates a challenging start to 2026 for the Sri Lankan tea industry, with the most significant impact observed in the Low and Medium Grown categories.
The comparison of CTC Tea Production for the period January to March 2026 against the corresponding period in 2025 reflects a strong overall improvement across all elevations, with a total increase of approximately 1.23 million kilograms.
High Grown CTC production recorded a moderate rise of about 0.18 million kilograms, increasing from 1.17 million kilograms in 2025 to approximately 1.36 million kilograms in 2026. While positive, this growth remains relatively modest compared to the other elevations. Medium Grown CTC teas showed the most significant improvement during the quarter, with production increasing by approximately 0.61 million kilograms, rising from around 2.03 million kilograms in 2025 to about 2.64 million kilograms in 2026. This category contributed the largest share to the overall gain.
Low Grown CTC production also demonstrated a notable increase of roughly 0.43 million kilograms, moving from approximately 2.18 million kilograms in 2025 to about 2.61 million kilograms in 2026, further strengthening the overall
growth trend.
In summary, total CTC Tea Production increased from approximately 5.38 million kilograms in 2025 to 6.61 million kilograms in 2026, indicating broad-based growth across all elevations. Medium Grown led the expansion, followed by Low Grown, while High Grown recorded a comparatively smaller but
steady increase.
The comparison of Sri Lanka Tea Sale Averages (Elevation Wise) for the period January to March 2026 against the corresponding period in 2025 indicates a mixed performance in Rupee terms, while US Dollar values declined across
all elevations.
In the High Grown category, the average price in Sri Lanka Rupees increased from Rs. 1,118.77 in 2025 to Rs. 1,151.02 in 2026, reflecting a gain of approximately Rs. 32.25. However, in US Dollar terms, the average declined slightly from $3.78 to $3.71, indicating the impact of currency depreciation despite the improvement in local prices. The Medium Grown segment recorded a noticeable decline in both currencies. The Rupee average dropped by approximately Rs. 55.10, falling from Rs. 1,040.44 in 2025 to Rs. 985.34 in 2026. Similarly, the US Dollar value decreased from $3.51 to $3.18, highlighting weaker market performance for this elevation. In the Low Grown category, which typically commands the highest share, the Rupee average declined by around Rs. 40.84, decreasing from Rs. 1,239.35 in 2025 to Rs. 1,198.51 in 2026. The US Dollar average also fell from $4.18 to $3.86, reflecting a consistent downward trend in international value.
Overall, the national average price decreased in both currencies. In Rupee terms, it declined by approximately Rs. 26.07, from Rs. 1,179.32 in 2025 to Rs. 1,153.25 in 2026. Meanwhile, the US Dollar average dropped from $3.98 to $3.72. In summary, although High Grown teas showed some resilience with a gain in Rupee value, all elevations experienced declines in US Dollar terms, and both Medium and Low Grown categories recorded decreases in Rupee values as well.
Sri Lanka’s tea exports for January to March 2026 declined in volume to 60.36 million kg, compared to 63.21 million kg in the corresponding period of 2025. Despite the reduction in quantity, export earnings remained broadly stable at Rs. 109.09 billion, slightly below Rs. 109.90 billion recorded in 2025. The average FOB price improved to Rs. 1,807.27 per kg in 2026 from Rs. 1,738.80 per kg in the previous year.
Segment-wise, tea in bulk recorded a decline in both quantity and value, although FOB prices increased. Tea in packets showed a marginal reduction in volume, while value and FOB prices recorded a slight improvement. Tea in bags remained relatively stable in quantity, with improved value and higher FOB prices. In contrast, instant tea and green tea both recorded growth in quantity, value, and FOB prices, reflecting continued strength in value-added exports.
Overall, the decline in export volumes was offset by improved pricing, particularly in value-added categories, resulting in relatively stable export earnings in Q1 2026.
The monthly average USD/LKR exchange rate indicates a clear depreciation of the Sri Lanka Rupee in Q1 2026 compared to the corresponding period in 2025. The average rate increased from Rs.296.30 in 2025 (January–March) to Rs. 310.31 in 2026, reflecting a weakening of the Rupee against the US Dollar by approximately Rs. 14.01 per unit. During Q1 2025, the exchange rate remained relatively stable, fluctuating within a narrow range between Rs. 295.91 and Rs. 296.80, indicating low volatility in the foreign exchange market.
In contrast, Q1 2026 recorded consistently higher rates, ranging from Rs. 309.36 to Rs. 311.91, showing a clear upward trend throughout the quarter.
Overall, the comparison highlights increased exchange rate pressure in 2026, resulting in a weaker Rupee and higher import cost implications when measured against the more stable currency environment observed in Q1 2025.
Sri Lanka’s tea exports by country for January to March 2026 show a mixed performance compared to the corresponding period in 2025, with both gains and declines across key markets. Turkey recorded the strongest growth, increasing significantly by 3.68 million kg, making it the leading growth market during the period. Azerbaijan also showed solid improvement, with exports rising by 0.87 million kg, while Syria and China recorded marginal increases of 0.34 million kg and 0.06 million kg respectively. In contrast, several major traditional markets recorded declines. Libya registered the largest drop, falling by 2.96 million kg, followed by the United Arab Emirates with a reduction of 1.83 million kg. Chile and Russia also declined by 1.01 million kg and 0.99 million kg respectively, while Iraq showed a marginal decrease of 0.27 million kg. Saudi Arabia remained largely stable with a negligible decline of 0.01 million kg.
Overall, the comparison indicates a shift in export distribution, with strong growth in Turkey partially offsetting declines in several key Middle Eastern and North African markets. Overall, Sri Lanka’s tea exports in Q1 2026 recorded a mixed performance, with strong growth in a few key markets such as Turkey and Azerbaijan offsetting declines in several traditional destinations, resulting in a rebalanced but uneven export pattern compared to Q1 2025.
A comparison of FOB prices and tea sale averages for the first quarter of 2025 and 2026 reflects a divergence between export value performance and auction market returns. In terms of FOB prices, Q1 2026 recorded a clear improvement over 2025 across all three months. January 2026 increased significantly to Rs. 1,821.71 per kg from Rs. 1,722.78 in January 2025. Although February 2026 showed a slight dip from January levels, it remained higher at Rs. 1,785.76 compared to Rs. 1,737.52 in February 2025. March 2026 also maintained this upward trend at Rs. 1,813.84, exceeding the corresponding 2025 figure of Rs. 1,753.16. Overall, this indicates stronger export pricing and improved value realization in international markets during Q1 2026.
Conversely, tea sale averages in 2026 demonstrated a consistent downward trend compared to 2025. January 2026 declined to Rs. 1,164.54 from Rs. 1,185.43 in January 2025, followed by further reductions in February and March to Rs. 1,152.11 and Rs. 1,144.23 respectively. This is in contrast to 2025, where sale averages remained relatively stable around the Rs. 1,170–1,185 range. The steady decline in 2026 suggests weaker auction market conditions and softer demand locally. In summary, while FOB prices in Q1 2026 showed a notable year-on-year increase, indicating favorable export market dynamics, tea sale averages moved in the opposite direction, reflecting some pressure in the domestic auction market.
In Q1 2026, FOB prices increased year-on-year across all three months, while tea sale averages declined consistently.
The comparison of tea sold quantities for Q1 (January–March) between 2025 and 2026 shows a mixed monthly performance with an overall slight improvement in 2026. In January 2026, sales declined to 20.70 million kg compared to 22.29 million kg in January 2025, reflecting a reduction of 1.59. February 2026 also recorded a marginal decrease at 20.91, down from 21.36 million kg in 2025. However, March 2026 showed a strong recovery, increasing significantly to 23.27 million kg from 19.33 million kg in March 2025, marking a substantial gain of 3.94 million kg.
On a quarterly basis, total tea sold improved slightly in 2026. The average for Q1 2025 stood at approximately 20.99 million kg, while Q1 2026 increased to about 21.63 million kg, indicating a modest overall growth in sales volume.
Overall, while early 2026 showed softer performance compared to 2025, the strong uplift in March helped offset earlier declines, resulting in a better quarterly outcome. Tea sold quantities in Q1 2026 showed a marginal overall improvement compared to 2025. Despite lower sales in January and February, a strong rebound in March significantly boosted performance. This recovery offset earlier declines, resulting in a modest increase in the quarterly average and indicating a slightly stronger overall sales volume in 2026.


