Tuesday Nov 03, 2026
Tuesday Nov 03, 2026
Tuesday, 3 November 2026 03:40 - - {{hitsCtrl.values.hits}}
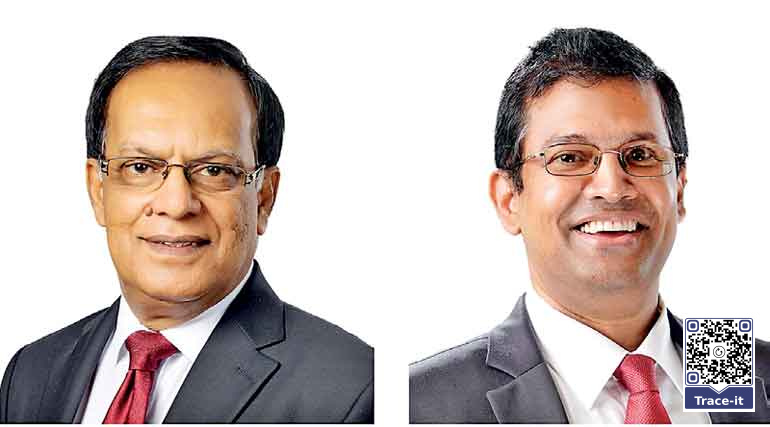
Chairman Justice Buwaneka Aluwihare, PC (left) and Director/CEO Ramesh Jayasekara
Seylan Bank yesterday said it posted a Profit Before Tax (PBT) of Rs. 14.04 million 3Q 2026, compared with Rs. 12.8 million in 3Q 2025, reflecting a year-on-year growth of 9.64%.
For the nine months ended 30 September 2026, the bank recorded a Profit After Tax (PAT) of Rs. 9.12 billion, an increase of 9.47% from Rs. 8.33 billion reported in the corresponding period of 2025.
Net Interest Income increased by 6.62% to Rs. 28.8 billion for the nine months ended 30 September 2026, compared with Rs. 27 billion recorded in the corresponding period of 2025. This growth was primarily driven by the significant expansion in the bank’s total assets over the year aptly supported by strong deposit mobilisation. However, the bank’s Net Interest Margin (NIM) declined from 4.5% in 2025 to 3.99% in 3Q 2026, due to the upward movement in market interest rates.
The bank’s net fee-based income recorded a growth of 18.19%, increasing to Rs. 7.1 billion in 3Q 2026 from Rs. 6 billion in the corresponding period of 2025. This growth was mainly attributable to increased fee income from cards, remittances, trade, loans and other financial services.
The bank’s total operating income increased by 8.87% to Rs. 37.2 billion in 3Q 2026, compared with last year’s Rs. 34.2 billion. This growth was primarily driven by increases in net interest income, net fee and commission income, net gains from derecognition of financial assets, and other operating income.
Total operating expenses increased by 13.54% to Rs. 18.6 billion for the nine months ended 30 September 2026, compared with Rs. 16.3 billion recorded in the corresponding period of 2025. Personnel expenses increased by 12.98%, from Rs. 8.7 billion to Rs. 9.9 billion, mainly due to annual salary revision. Other operating expenses including depreciation and amortisation expenses increased by 14.2%, reflecting higher prices of consumables and other related cost of services during the period. The bank continues to implement targeted cost optimisation initiatives to manage overhead cost effectively.
The bank recorded a net impairment reversal of Rs. 232 million in 3Q 2026, compared with a charge of Rs. 645 million reported in 3Q 2025. The bank continues to ensure that impairment provisions adequately reflect changes in global and domestic economic conditions, the credit risk profiles of customers, and credit quality of its loan portfolio. These measures are aimed at maintaining the adequacy of provisions recognised in the financial statements. The bank’s asset quality indicators remained stable, with the Impaired Loan (Stage 3) Ratio at 1.02% as at 30 September 2026, compared with 1.03% in December 2025. Meanwhile, the Stage 3 Provision Coverage Ratio stood at 84.98%, reflecting the bank’s Strong provision coverage.
Income tax expenses increased by 9.96% to Rs. 4.9 billion for the nine months ended 30 September 2026, compared with Rs. 4.5 billion in the corresponding period of 2025. Value Added Tax on Financial Services and the Social Security Contribution Levy increased by 10.53%, from Rs. 4.4 billion to Rs. 4.9 billion during the first nine months of 2026.
During the period the bank’s total assets surpassed the one trillion mark and increased to Rs. 1.01 trillion from Rs. 921 billion reported in 2025. Seylan Bank became the fourth private commercial bank in Sri Lanka to reach this milestone. The bank continues to attract new customers for loans and deposits, while strengthening relationships with its existing customer base.
Loans and advances recorded a net growth of Rs. 89 billion, reaching Rs. 689 billion, while customer deposits increased by Rs. 78 billion to Rs. 811 billion during the first nine months of 2026. The bank’s CASA ratio stood at 26%.
Key financial ratios and indicators of Seylan Bank PLC remained sound as at 30 September 2026. The bank maintained capital adequacy ratios well above the regulatory minimum requirements, with both the Common Equity Tier 1 Capital Ratio and the Total Tier 1 Capital Ratio standing at 11.12%, while the Total Capital Ratio stood at 15.14%.
The bank’s liquidity position remained strong, with the All Currency Liquidity Coverage Ratio (LCR) and the Rupee LCR recorded at 163.01% and 171.69%, respectively, both well above the minimum statutory requirements.
The bank’s asset quality indicators remained strong, with Impaired Loan (Stage 3) Ratio standing at 1.02%, compared with 1.03% in 2025. The Stage 3 Impairment Provision Coverage Ratio stood at 84.98%, one of the highest in the banking industry.
The Return on Equity (ROE) stood at 14.44%, compared with 15.89% in 2025, while the Return on Average Assets (before tax) was 1.94%, compared with 2.31% in the corresponding period.
The bank’s Earnings per Share (EPS) increased to Rs. 14.34 in 3Q 2026, compared with Rs. 13.10 recorded in 3Q 2025. As at 30 September 2026, the Net Asset Value per Share stood at Rs. 136.68 for the bank and Rs. 140.09 for the group.
The National Long Term Rating of Seylan Bank, was upgraded by two notches, to A+(lka) with a Stable Outlook by Fitch Ratings in 2025.