Thursday Jul 30, 2026
Thursday Jul 30, 2026
Tuesday, 1 February 2022 02:41 - - {{hitsCtrl.values.hits}}
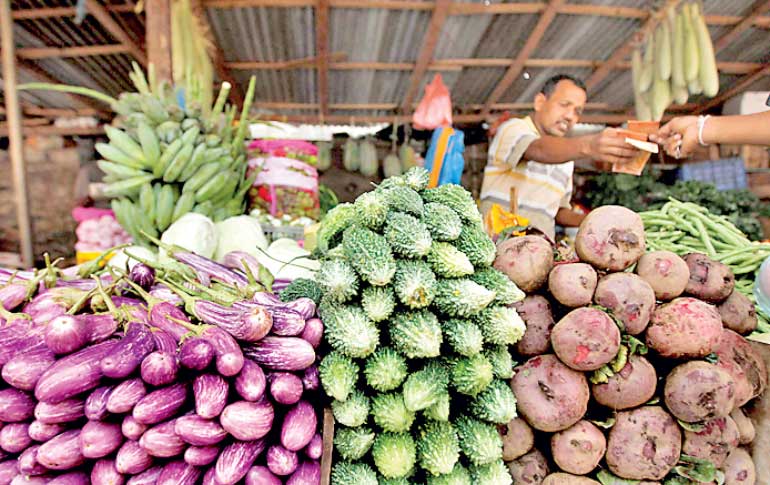
Reaffirming worsening cost of living, inflation in January has increased to 14.2% up from 12.1% in December.
According to Colombo Consumer Price Index (CCPI) data released yesterday by the Department of Census and Statistics (DCS), the year-on-year (YoY) food inflation increased to 25%, up from 22.1% in December, and the year-on-year inflation of Non Food Group increased to 9.2% in January 2022 from 7.5% in December 2021.
The moving average inflation rate for the month of January 2022 is 6.9%. The corresponding rate for the month of December 2021 was 6%.
For January, on YoY basis, contribution to inflation by food commodities was 7.96%. The contribution of Non Food items was 6.27%. This was mainly due to increases in value change in groups of ‘Restaurants & Hotels’ (1.54%), ‘Housing, Water, Electricity, Gas and Other Fuels’ (1.44%), ‘Transport’ (1.32%), ‘Health’ (0.52%), ‘Miscellaneous Goods and Services’ (0.33%), ‘Education’ (0.28%), ‘Furnishing Household Equipment and routine Household Maintenance’ (0.32%), ‘Clothing and Footwear’ (0.31 %), ‘Alcoholic beverages Tobacco and Narcotic’ (0.15%), ‘Recreation and Culture’ (0.04%), and the group of ‘Communication’ remained unchanged during the period.
The CCPI for all items for January was 158.4 and it recorded an increase of 3.7 in index points that is 2.43% compared to December 2021 for which the index was 154.7. This represents an increase of expenditure value by Rs. 2271 in the ‘Market Basket’.
The month-on-month change was contributed by increases of Food items by 1.15% and Non Food items by 1.28% respectively. The increases in value change were reported for Rice (0.34%), Fresh Fruits (0.19%), Bread (0.11%), Milk Powder (0.11 %), Sea Fish (0.08%), Green Chilli (0.09%), Chilli Powder (0.06%), Red Onions (0.04%), Curry Powder (0.04%), Buns (0.02%), Chicken (0.03%), Coconut Oil (0.03%), Potatoes (0.03%), Wheat Flour (0.02%), Green Gram (0.01 %), Beef (0.02%), Dried Fish (0.02%), Yogurt (0.02%), Dhal- Mysoor (0.02%), Dry Chillies (0.02%), Canned Fish (0.01 %), Margarine (0.01 %), Infant Milk powder (0.01 %), Garlic (0.01 %), Sugar (0.01 %), Pepper (0.01 %) and Tea dust/leaves (0.01).
Decreases in value change were reported for Coconuts (0.05%), Vegetables (0.09%), Big Onions (0.04%), Limes (0.04%) and Turmeric Powder (0.02%).
Among Non-Food groups, increases in value change were reported for the groups of ‘Transport’ (0.57%),’Housing, Water, Electricity, Gas and Other Fuels’ (0.26%), ‘Restaurant and Hotels’ (0.14%),’Miscellaneous Goods and Services’ (0.09%), ‘Education’ (0.14%), ‘Clothing and Footwear’ (O.03%),’Furnishing Household Equipment and Routine Household Maintenance’ (0.02%), ‘Alcoholic beverages Tobacco and Narcotic’ (0.02%) and ‘Recreation and Culture’ (0.01 %). However, the groups of ‘Communication’ and ‘Health’ remained unchanged, according to DCS.


