Friday Jul 10, 2026
Friday Jul 10, 2026
Saturday, 8 October 2022 00:00 - - {{hitsCtrl.values.hits}}
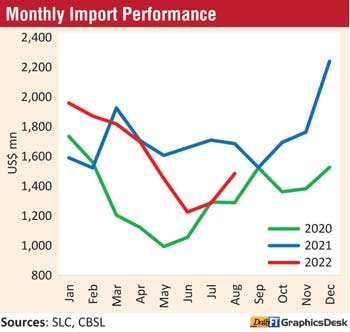 Imports in August have hit a four-month high and marked the fourth consecutive monthly gain despite restrictions and the forex crisis
As per Central Bank data imports in August amounted to $ 1.48 billion highest since the April figure of $ 1.7 billion.
Imports have also grown month-on-month since May. In July imports were $ 1.28 billion, $ 1.24 billion in June and $ 1.45 billion in May.
However, year-on-year, August imports were down by 12% and CBSL said it was the sixth consecutive month dip year-on-year.
CBSL said in August a decline in expenditure was observed in investment goods and non-food consumer goods, while an increase was recorded in imports of intermediate goods and food and beverages. Import expenditure on a cumulative basis from January to August amounted to $ 12,801 million, which is a decline of 4.6% (y-o-y).
Considering the need to prioritise essential imports amidst a shortage of forex liquidity, the Government tightened import restriction measures on non-urgent imports during August, which, however, were partially relaxed in September.
“Import expenditure is showing a tendency to increase on a month-on-month basis, since bottoming out in June 2022, which prompted the Government to further tighten import restrictions in August 2022 in order to preserve forex for essential imports, although some of which were relaxed in September 2022,” CBSL said.
Expenditure on the importation of consumer goods declined by 28.7% in August, compared to August 2021, driven by a decline in expenditure on non-food consumer goods despite an increase in expenditure on food and beverages.
The decline in import expenditure on non-food consumer goods was observed in all subcategories, with a notable drop in imports of medical and pharmaceuticals (mainly, vaccines), telecommunication devices (mainly, mobile telephones) and home appliances (mainly, televisions). In contrast, expenditure on the importation of food and beverages increased by 17.2% in August (y-o-y), with a substantial share of the increase being contributed by the imports of cereals and milling industry products (primarily, rice), and sugar.
However, expenditure on dairy products (mainly, milk powder), seafood (mainly, dried and fresh fish), oils and fats (mainly, coconut oil), vegetables (mainly, big onions) and fruits declined in August, compared to August 2021.
Expenditure on the importation of intermediate goods increased by 2.6% in August, compared to August 2021, mainly driven by fuel, textiles and textile articles (mainly, fabrics) and fertiliser (mainly, urea).
Further, import expenditure on chemical products; diamonds and precious stones and metals (primarily, industrial diamonds); paper and paperboard and articles thereof; and rubber and articles thereof also recorded an increase during August, compared to August 2021.
Meanwhile, many other types of intermediate goods recorded a notable decline, including base metals (mainly, iron and steel), wheat and maize, agricultural inputs (mainly, animal fodder), vehicle and machinery parts, etc. However, import expenditure on fuel, which consists of crude oil, refined petroleum and coal, increased by 10.2% (y-o-y) to $ 389 million in August, and the increase was attributed to higher average import prices despite lower import volumes of crude oil and refined petroleum. The average import price of crude oil was $ 114.71 per barrel in August, compared to $ 74.88 per barrel in August 2021.
Import expenditure on investment goods declined by 39.5% in August, compared to August 2021, resulting from a decline in all subcategories. The decline in the expenditure on machinery and equipment imports was led by reduced import expenditure on computers, harvesting machinery and transmission apparatus, among others.
Import expenditure on building materials decreased, mainly owing to lower imports of iron and steel (primarily, iron bars and rods), cement, and mineral products. Meanwhile, lower importation of commercial vehicles, such as agricultural tractors and tankers and bowsers, contributed mainly to the drop in the import expenditure on transport equipment.
The import volume index declined by 23.6% (y-o-y), while the import unit value index increased by 15.4%, in August, implying that the decline in import expenditure in August was mainly driven by the volume effect.
Relatively lower imports and higher exports led to the narrowing of the deficit in the merchandise trade account to $ 261 million in August compared to the deficit of $ 586 million a year ago. However, it widened compared to July.
The cumulative deficit in the trading account during January-August also narrowed to $ 3,899 million from $ 5,507 million recorded over the same period in 2021.
Earnings from merchandise exports grew by 11.2% in August, over August 2021, to $ 1,224 million. An increase in earnings was observed in industrial and agricultural exports, while a decline was recorded in mineral exports.
Cumulative export earnings from January-August increased by 12.6% over the same period in the last year, amounting to $ 8,902 million. This growth was entirely driven by the improvements observed in industrial exports.
Industrial exports: Earnings from the export of industrial goods increased in August by 12.6%, compared to August 2021. Higher export earnings from garments contributed to a major share of this outcome (an increase in earnings from garments exports contributed 70.6% of the growth in total exports). Export of garments to all major markets (the USA, the EU, and the UK) improved. Meanwhile, most of the other industrial export categories also showed improved performance, particularly, gems, diamonds, and jewellery; animal fodder (mainly, wheat residues); machinery and mechanical appliances (mainly, mechanical appliances parts); and rubber products (mainly, rubber tires). In contrast, export earnings from food, beverages and tobacco, petroleum products and textiles (primarily, cotton fabrics) declined in August.
The decline in earnings from food, beverages and tobacco was due to the decline in almost all sub-sectors except cereal preparations. Earnings from exports of petroleum products recorded a decline of 30.2% in August (y-o-y), due to lower volumes of bunker and aviation fuel supplied despite a notable increase in average export price. Further, base metals and articles; plastics and articles thereof; and printing industry products also declined to some extent.
Agricultural exports: Earnings from the exports of agricultural goods increased by 6.2% in August, compared to August 2021, mainly due to the increase in earnings from tea, seafood (mainly, fresh and frozen fish) and minor agricultural products (mainly, edible nuts; vegetable oil and oil seeds; and betel leaves), while export earnings from vegetables and spices increased marginally. Export earnings from tea increased by 6.5% in August (y-o-y) mainly driven by high prices (increased by 18.9%) amidst low volumes (declined by 10.4%). Meanwhile, there was a decline in export earnings from coconut-related products (primarily, desiccated coconut, fibres and coconut oil), unmanufactured tobacco and natural rubber.
Mineral exports: Earnings from mineral exports declined by 21.3% in August, compared to August 2021, mainly due to a decline in export earnings from titanium ores and zirconium ores categorised under ores, slag, and ash.
The export volume index and unit value index improved by 6.0% and 4.9% (y-o-y), respectively, in August. Thus, the increase in export earnings could be attributed to the combined impact of higher export volumes and prices.

