Wednesday May 27, 2026
Wednesday May 27, 2026
Thursday, 26 May 2022 00:58 - - {{hitsCtrl.values.hits}}
ICT services sector is the country's fourth largest export earner with over 300 companies that currently serve several Industry verticals. Broadly it is segmented as Information Technology (IT) and Information Technology enabled Services (IT/ITeS) (SLEDB). The industry is adamant about adhering to global labour and environmental standards. The combination of a highly skilled talent pool and cost-effective operational capability makes Sri Lanka's ICT Industry one of the most profitable industries to date. It is estimated to be $ 1.2 billion industry with over 80,000 employees engaged in professional services (SLASSCOM). The last three years has seen the industry transform into one that supports remote workers, virtual teams, and hybrid workplaces as the norm.
For the third consecutive year, Great Place to Work conducted a study into workplace culture within the IT/ITeS industry in Sri Lanka. The study allowed for the publication of a list of the 10 Best Workplaces in the IT/ITeS industry. The global Great Place to Work For All model was used to select the Best Workplaces™ who create an overwhelmingly positive and consistent workplace experience. Organisations that were Great Place to Work Certified™ from April 2021 to April 2022 were considered for selection. This article details the key insights from the study with a focus on innovation as an area of interest for the sector.
During this year’s study cycle, approximately 7,500 employees were surveyed with an average response rate of 90%. The sample represented around 40 organisations in the IT/ITeS sector and a workforce of 10,000 employees.
Results Overview
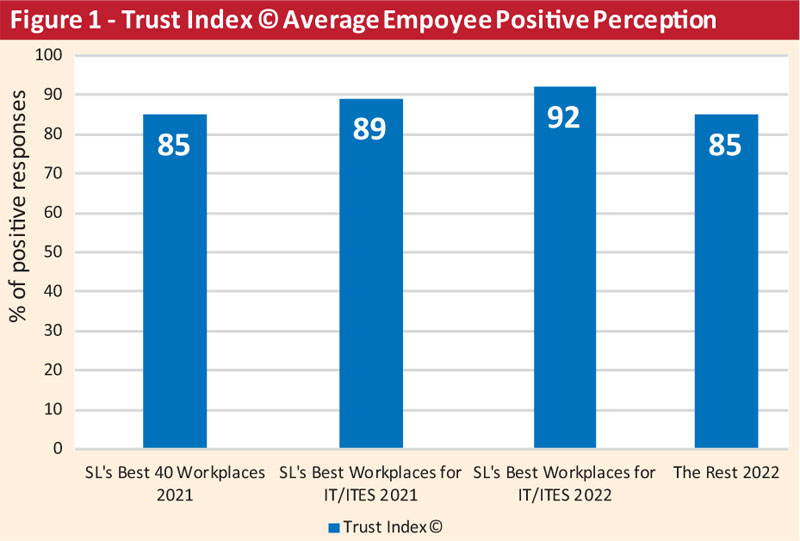
Figure 1 compares the Trust Index© average employee positive perception (TI). The TI is a measure of the average positive perception of employees across 58 core global statements and provides an ‘analytical view-point’ of an employee.
With an increase from last year, more notable is the 7-point difference the average of the Best IT Workplaces has over the national benchmark – the average positive perception of the 40 Best Workplaces in Sri Lanka from 2021. In general, it appears that the IT/ITeS Sector shows a greater propensity for highly positive employees. However, the 7-point difference between the Best and the Rest of the surveyed organisations in the sector shows the average range in employee experience across the study and therefore space for improvement.
Key Focus Areas
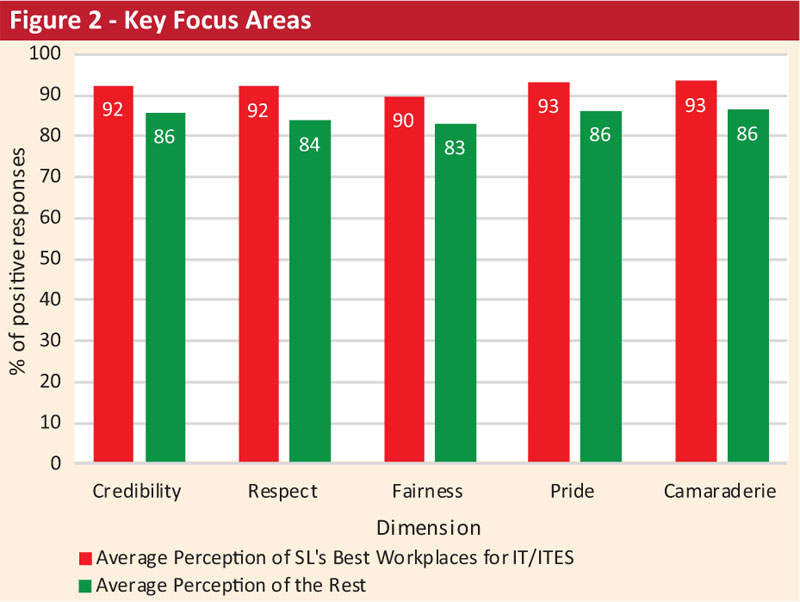
Figure 2 shows the key focus areas measured by the employee perception survey. Similar to trends seen with national and global data, fairness is the area of lowest positive perception. Pride is usually the area of highest average positive perception, but for IT/ITeS organisations Camaraderie is also on par with it. The largest gap between the Best 10 vs the Rest is in the focus area of ‘Respect for the individual’ which includes sub focus areas of professional support (training and development, resources), collaboration and demonstrated caring (enabling work life balance, benefits, facilities, sincere care).
 Key Drivers
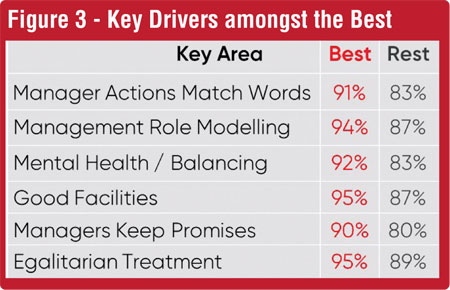
Figure 3 presents the key drivers of the Best Workplaces in the IT sector. These are the areas that IT/ITeS sector employees deem important in considering the workplace as great, and the perception of these areas impact the overall employee perception the most. It’s noteworthy that Manager Reliability ranks highly and is represented more than once as ‘Manager actions match words’ as well as ‘Managers keep promises’, with a larger margin between the Best 10 and the Rest as well. Having a healthy environment that contributes to balancing of psychological and emotional state also shows a marked difference between the Best vs. the Rest.
Figure 3: Key Drivers amongst the Best 10 in IT/ITeS
 Key Organisational Health Indicators
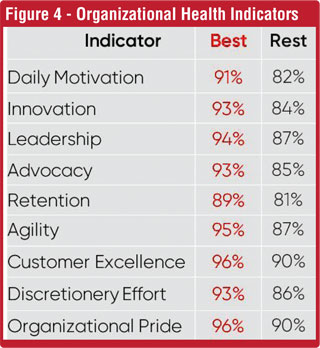
When exploring some key indicators of the health of organisational culture in Figure 4, Pride is of the highest positive perception while Retention is relatively the lowest. Comparing the results of the Best and the Rest, the largest margins are in ‘Daily Motivation’ to come to work and ‘Recognition of Innovation’ contributions by employees. Especially in this sector, being behind the pack in these areas would make an organisation ill equipped to be competitive in the market in the long run.
Figure 4: Organisational Health Indicators
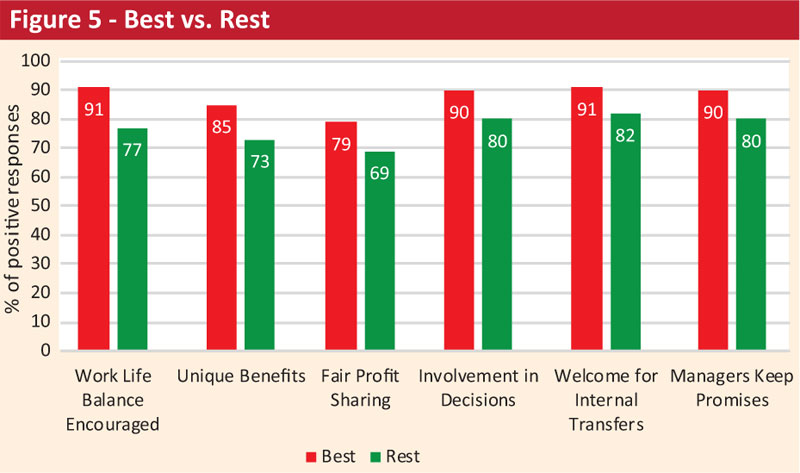
Best Vs. the Rest
Looking into the biggest gaps across survey themes between the Best 10 vs. the Rest in Figure 5, in terms of Work Life Balance, the Best outperform the Rest by 14% points in perception while Unique Benefits comes second in line with a 12%-point difference.
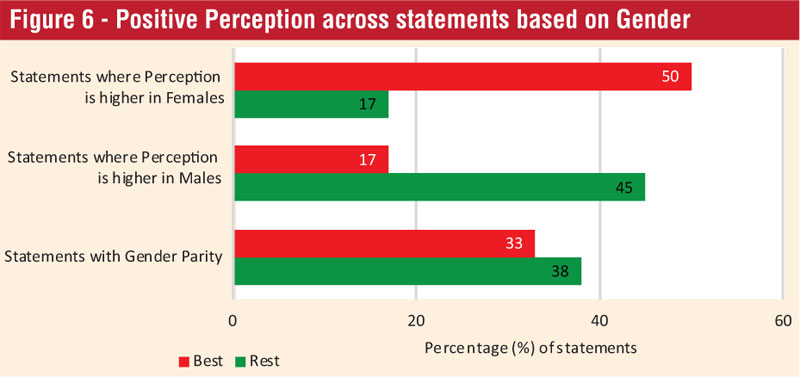
Demographic highlights
This section explores the variation in perception across standard demographics within the surveyed organisations in the IT/ITeS sector, namely gender, age and tenure.
When looking at the overall study, there is only a 1-point difference between men and women in both the Best 10 and the Rest, so gender parity might be assumed. However, Figure 6 is a comparison of the responses to the 58 survey statements based on the two main genders. Gender parity or equal perception in employees of the 10 Best Workplaces for 2022 is seen in 33% of statements, but notably increases to 38% among the Rest. And although this initially suggests a better experience amongst the Rest, historically, women have had a less positive experience in the workplace. As such, only 17% of survey statements receiving a more positive perception from women among the Rest, while this increases to 50% among employees of the Best, suggesting that the Rest have work to do in ensuring gender equality on behalf of women in the workplace.
When looking at the age demographic, the age group 35 to 44 years are the least positive, with an 8-point difference from the most positive Gen X employees, as seen in Figure 7. The biggest concerns this group appears to have in relation to the rest of the age groups are around communication with the management; genuine use of feedback, getting straight answers and managers walking the talk. The 45 years to 54-year age group is relatively more positive about unique benefits and avoiding manager favouritism when compared to other age groups.
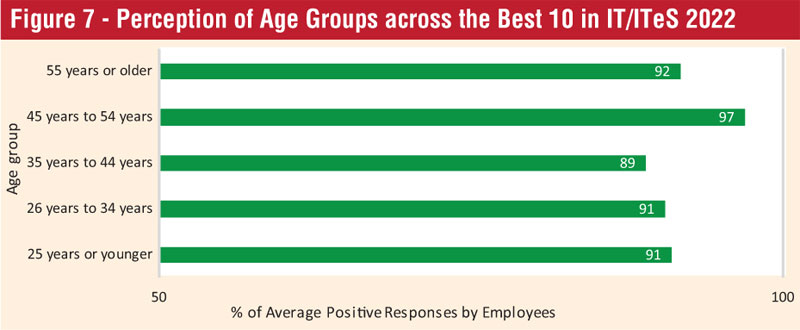
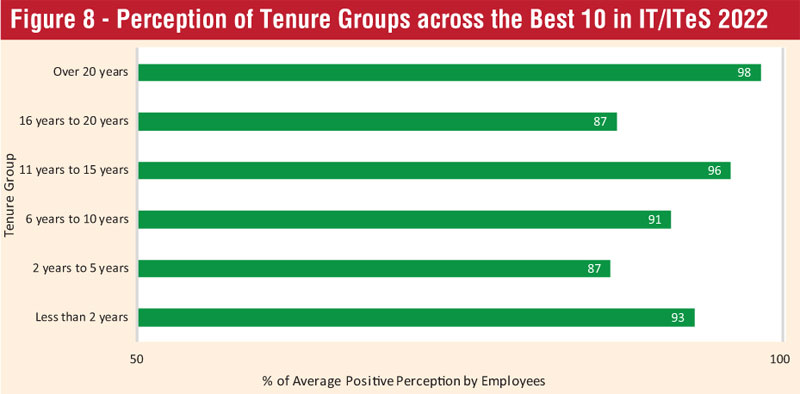
Figure 8 similarly showcases the Perception based on Tenure. A predictable trendline cannot be seen here as it is usually seen against national or global data. Interestingly, the longest serving employees (over 20 years) are the most positive, with sharp dips in those of 16 to 20 years tenure and 2 to 5 years in the workplace. Delving into the data shows that both groups have low perception around fair promotions. Additionally, top-down communication, egalitarian treaent, and training and career development opportunities are concerns for the 16-to-20-year tenured group. Fair pay and profit share and appreciation of effort are concerns for 2-to-5-year tenured employees.
Innovation by All
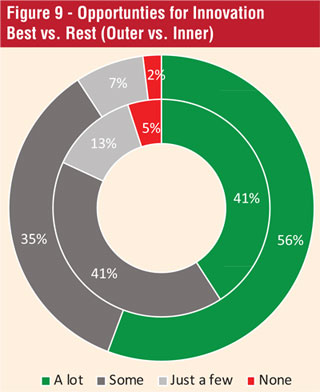 Innovation is the buzzword of competitive industries, and rightly so, with conditions arising from the pandemic compelling organisations to find new ways of overcoming unexpected barriers. In the IT/ITeS sector, with its trend for rapid evolution, this plays an even greater role. Figure 9 shows that 91% of employees in the Best 10 Workplaces perceive that they have a significant number of opportunities to innovate, whereas only 82% of those in the Rest perceive that they get similar opportunities and, in fact, twice the percentage in the Rest perceive that they experience few or no opportunity to innovate as their counterparts from the Best Workplaces. Great Place to Work global research also highlights that employee perception of their organisation being a great workplace is higher when employees feel positive about contributing to continuous improvement and long-term innovation for the organisation.
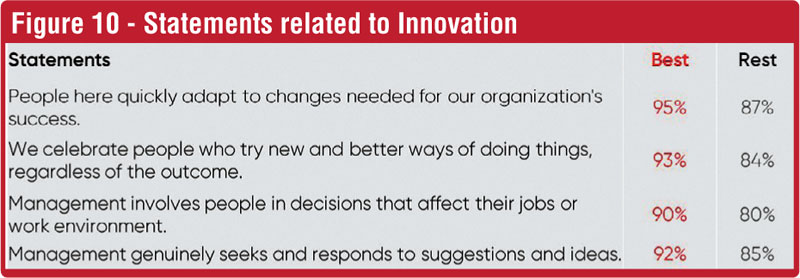
Apart from the availability of opportunity, the roots of a truly innovative culture should have high adaptability and a leadership that encourages, recognises, and involves all employees. Further examination of key statements related to the roots of innovation are displayed in Figure 10, showing high positive perception amongst employees of the Best, but a notable relatively lower perception in the same statements for employees of the Rest. As such, it is clear that organisations looking to improve need to focus more on proactively promoting an environment which supports the entire creative process.
Figure 10: Statements related to Innovation
 Innovation Velocity Ratio
Great Place to Work research shows the Innovation Velocity Ratio (IVR) is a simple-but telling metric of an organisation’s agility and invention. Organisations with the highest IVRs enjoy higher levels of discretionary effort, less risk of turnover, greater adaptability, and faster revenue growth.
Put simply, IVR is a figure representing the number of employees who feel willing and able to innovate in relationship to the number of employees who do not feel able to innovate.
Figure 11: Stages of Innovation by All
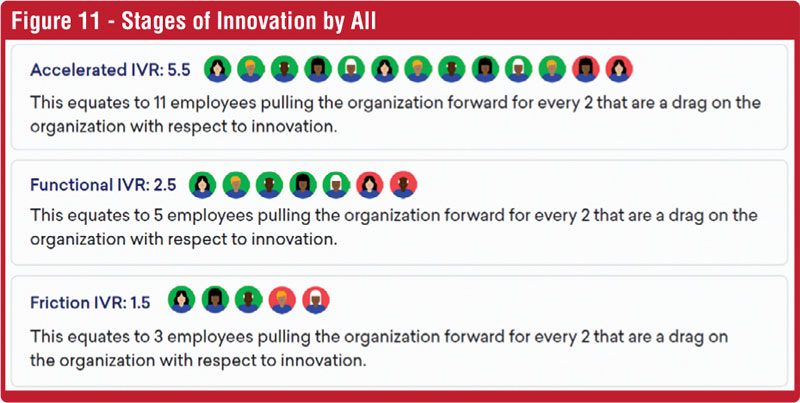
Great Place to Work found that organisations fall into three broad categories with respect to their Innovation Velocity Ratios. These are called the Stages of ‘Innovation By All’ and are depicted in Figure 11. Looking into the study for IT/ITeS sector in 2022 shows that the Best 10 have an average IVR of six which shows accelerated contribution of employees to the innovation effort versus the Rest in the study which average at an IVR of two, thereby falling into the friction category. Organisations looking to better understand IVR and accelerate innovation efforts can read the Innovation Insights Series of research papers at greatplacetowork.com.
Overall, the study output shows, that amid the highly competitive environment in which the IT/ITeS sector culture is constantly evolving, staying true to the course of clear communication, egalitarian treaent and collaboration with employees, providing opportunities to contribute to continuous improvement will allow organisations to build a Great Place to Work For ALL culture based on trust that will drive employee engagement and in turn, organisational performance.
Great Place to Work’s mission is to help every workplace become a Great Place to Work For All so that organisations can maximise human potential through a High-Trust, High-Performance Culture that drives business, improves lives, and creates a better society. No matter where you are in your journey, you are invited to join in to discover and drive your employees’ positive perception and contribute to achieving the vision of making Sri Lanka a great place to work.
Methodology for selecting Best Workplaces
Great Place to Work is the globally recognised authority on studying and recognising Best Workplaces. Over the past 30 years it has studied Great Workplaces and expanded its reach to over 90 countries. Organisations utilise many services to benchmark, understand key strengths and areas to improve on and take action so as to drive workplace culture that supports organisational performance. The Sri Lankan study is based on the global model and a rigorous methodology, which has been researched, tested and carried out in similar studies worldwide.
The selection follows the global ‘Great Place to Work For All’ methodology. 85% of the evaluation is based on the experience of trust and employees reaching their full human potential as part of their organisations- no matter who they are or what they do. These experiences are analysed in relation to each company’s size, workforce demographics and industry norms. The remaining 15% of the evaluation is based on all employees’ daily experiences of innovation, their organisations’ values and the effectiveness of their leaders to ensure consistent experience.
The measurement tool used to assess workplace culture is based on two lenses; Firstly, the Trust Index© employee perception survey is conducted to understand the employee workplace experience and constitutes 75% of the total organisation score. Organisations are measured on whether employees Trust the people they work for, have Pride in work they do and share Camaraderie among people they work with. Secondly, the practices and processes in place to drive the employee experience are evaluated through a central submission termed the Culture Audit© which constitutes the remainder 25% of the total score. Results for each of the listed organisations are audited to maintain accuracy and validity of its inclusion in the Best Workplaces List.


