Thursday Oct 15, 2026
Thursday Oct 15, 2026
Thursday, 30 July 2026 04:36 - - {{hitsCtrl.values.hits}}
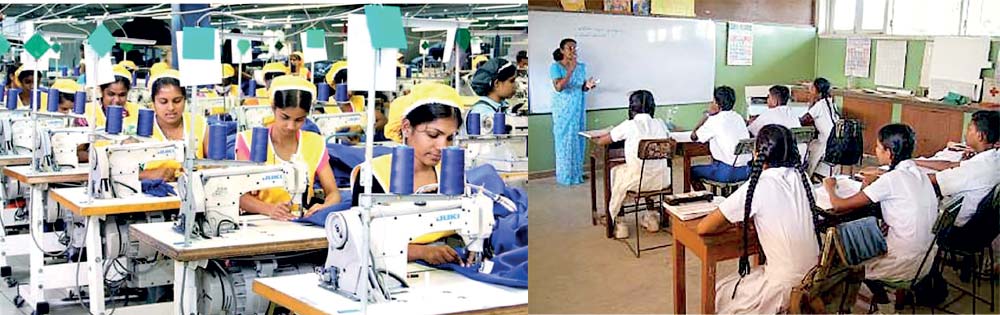
Teachers, factory workers, executives and business owners all pay the same VAT rate when purchasing the same item. Consequently, indirect taxes tend to consume a larger proportion of the income of poorer households than of wealthier households
 The key test will be whether policymakers are prepared to take bold and politically challenging measures to broaden the direct tax base and gradually rebalance the direct-indirect tax mix
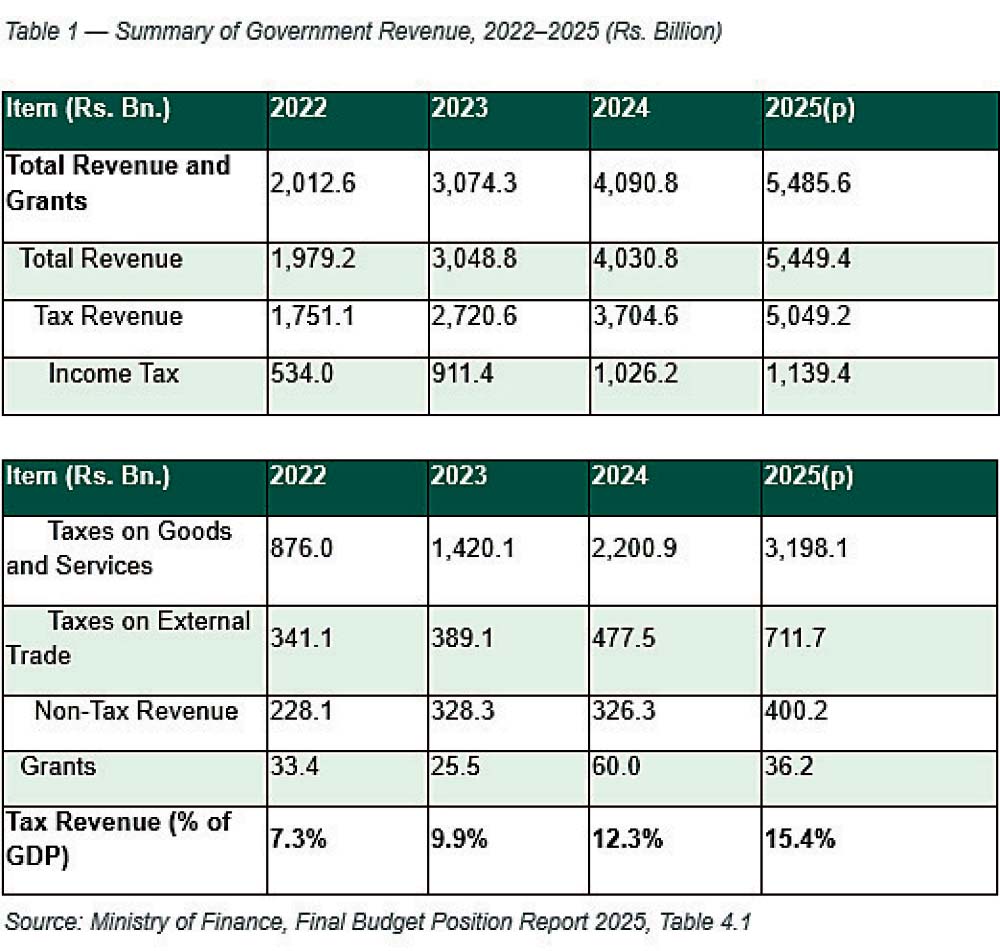
 Sri Lanka’s fiscal turnaround since the 2022 economic crisis has been remarkable. Government tax revenue has nearly tripled from Rs. 1.75 trillion in 2022 to Rs. 5.05 trillion in 2025, while the tax-to-GDP ratio has increased from 7.3% to 15.4%—the highest level recorded since 1997.
The 2025 Final Budget Position Report issued by the Ministry of Finance rightly celebrates this achievement as a cornerstone of fiscal stabilisation and debt sustainability. However, beneath this success story lies a structural concern that deserves greater attention: the increasing imbalance between direct and indirect taxation.
The issue is not whether Sri Lanka is collecting more taxes—it clearly is. The more important question is who ultimately bears the burden of those taxes.
Revenue story dominated by indirect taxes
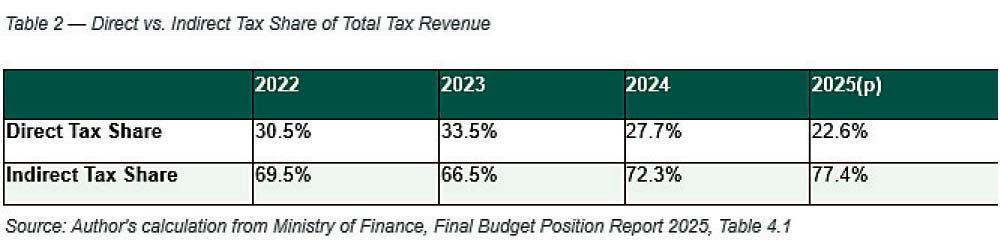
According to the Ministry of Finance Annual Report 2025, total tax revenue reached Rs. 5.05 trillion in 2025. Income tax generated Rs. 1.14 trillion, while taxes on goods and services and taxes on external trade together generated nearly Rs. 3.91 trillion. This means that only 22.6% of tax revenue came from direct taxation, while 77.4% came from indirect taxation.
Table 4.1 of the report breaks tax revenue into three components: Income tax (a direct tax on individuals and companies), taxes on goods and services (VAT, excise duty, and similar consumption taxes), and taxes on external trade (import duties, PAL, CESS, and related levies). The latter two are indirect taxes — charged on spending, not earnings, so a factory worker and a corporate director pay identical rates.
The trend over the past four years reveals:
The brief improvement in 2023 suggested Sri Lanka was moving toward a more balanced tax structure. Instead, the subsequent two years saw a sharp reversal. By 2025, for every Rs. 1 collected from direct taxes, the Government collected approximately Rs. 3.4 from indirect taxes.
Engine of revenue growth
Two forces drove the widening skew in 2025, and both sit on the indirect side of the ledger.
First, VAT revenue grew 33.4% to Rs. 1,746.9 billion, driven by a 49.2% surge in VAT collected on imports (to Rs. 891.4 billion) alongside a 20.1% rise in VAT on domestic activity (to Rs. 855.5 billion).
Second, the lifting of Sri Lanka’s multi-year suspension on vehicle imports in February 2025 triggered an extraordinary Rs. 413.2 billion jump in Excise Duty collected on motor vehicles alone, from Rs. 58.6 billion in 2024 to Rs. 471.8 billion in 2025. Combined with related levies (CID, VAT, and the Luxury Motor Vehicle Tax), taxes tied to vehicle imports alone reached 2.8% of GDP.
Income tax did grow too, up 11.0% to Rs. 1,139.4 billion, helped by a higher corporate tax rate on liquor, tobacco, and betting and gaming (raised from 40% to 45%), the imposition of 15% income tax on export-of-services income, and a rise in withholding tax on interest from 5% to 10%. The number of registered taxpayer files also grew 19.2%, to 1.3 million.
This outcome is not surprising. Indirect taxes, particularly VAT, are comparatively easier to administer, provide a broad and reliable revenue base, and deliver immediate fiscal gains. Excise duties and import-related taxes also generate substantial revenue with relatively low administrative and compliance costs.
At a time when Sri Lanka urgently needed to strengthen Government finances, meet IMF program commitments, and restore macroeconomic stability, these instruments offered the quickest and most effective path to revenue mobilisation.
However, efficiency and equity do not always move in tandem.
The more important question is how policymakers will shape the next phase of tax reform. As Sri Lanka’s revenue position strengthens, attention is likely to shift from simply raising revenue to improving the balance and fairness of the tax system.
The key test will be whether policymakers are prepared to take bold and politically challenging measures to broaden the direct tax base and gradually rebalance the direct-indirect tax mix. A more equitable distribution of the tax burden would reduce excessive reliance on consumption taxes and align Sri Lanka more closely with a tax structure that promotes both fiscal sustainability and fairness.
Personal and corporate income tax together made up 38.8% of tax revenue in Asia-Pacific economies on average, 40% in Africa, 27% in Latin America and the Caribbean, and 35.6% in the OECD — against Sri Lanka’s 23–27%
Why the imbalance matters
Direct taxes are generally linked to a taxpayer’s ability to pay. Higher earners contribute more, while lower-income households contribute less.
Indirect taxes operate differently. Every consumer pays VAT on most purchases regardless of income. A teacher, factory worker, executive, and business owner all pay the same VAT rate when purchasing the same item.
Consequently, indirect taxes tend to consume a larger proportion of the income of poorer households than of wealthier households. When indirect taxes account for more than three-quarters of tax revenue, the tax burden inevitably shifts toward consumption and, by extension, ordinary citizens.
This raises an important policy question: Has Sri Lanka achieved revenue recovery by relying excessively on consumers rather than broadening contributions from higher-income individuals and profitable businesses?
On the indirect side, taxes on goods and services averaged 50% of tax revenue in Asia-Pacific, 51.2% in Africa, 49.2% in Latin America and the Caribbean, and just 31.2% in the OECD — all well below Sri Lanka’s 70.8%.
International perspective
Sri Lanka’s tax structure contrasts sharply with that of most advanced economies.
Developed countries typically rely much more heavily on direct taxes, including personal income taxes, corporate taxes, and social security contributions. Consumption taxes remain important, but they do not dominate the tax system to the extent seen in Sri Lanka.
As per the statistics provided the direct versus indirect taxation shows that Sri Lanka’s indirect tax dependence has increased steadily. The 2025 composition of 22.6% direct taxes and 77.4% indirect taxes is characteristic of many lower-income economies where tax authorities face challenges in expanding the income tax base and improving compliance.
As economies develop, the usual trajectory is the opposite: greater reliance on direct taxation and less dependence on taxes at the point of consumption.
Based on the OECD Revenue Statistics in Asia and the Pacific 2026, the Asia-Pacific region continues to rely more heavily on indirect taxation than on direct taxation. In 2024, in the region, taxes on goods and services accounted for 50% of total tax revenue, compared with 38.8% from taxes on income and profits, implying a regional direct-to-indirect tax ratio of approximately 0.8:1.
The OECD’s country-level data for Sri Lanka, compiled using the same classification it applies across the region, confirms the picture from the Ministry of Finance’s report and sharpens it further.
In fiscal year 2024, Sri Lanka collected Rs. 279.9 billion from personal income tax and Rs. 584.1 billion from corporate income tax — together just 23% of total tax revenue, rising to 27.4% once unallowable income-related items such as withholding tax on interest are included. Taxes on goods and services, by contrast, accounted for Rs. 2,652.9 billion, or 70.8% of the total, with VAT alone contributing 34.9% (figures align closely with the Ministry of Finances’ 2025 report).
Set against the OECD’s regional averages for 2024, calculated on an identical basis, Sri Lanka’s imbalance stands out clearly. Personal and corporate income tax together made up 38.8% of tax revenue in Asia-Pacific economies on average, 40% in Africa, 27% in Latin America and the Caribbean, and 35.6% in the OECD — against Sri Lanka’s 23–27%.
On the indirect side, taxes on goods and services averaged 50% of tax revenue in Asia-Pacific, 51.2% in Africa, 49.2% in Latin America and the Caribbean, and just 31.2% in the OECD — all well below Sri Lanka’s 70.8%.
Even within its own regional peer group, where consumption taxes already dominate, Sri Lanka relies on VAT, excise and trade taxes roughly 20 percentage points more than the Asia-Pacific average, while collecting proportionally less than every regional benchmark, including Africa and Latin America, from personal and corporate income.
The sharp increase in Sri Lanka’s tax-to-GDP ratio in 2024 was driven largely by VAT reforms—including the removal of exemptions and the increase in the VAT rate from 15% to 18%—further reinforcing the country’s reliance on consumption-based taxation.
This highlights Sri Lanka’s structural divergence from regional norms and underscores the continued need to broaden and strengthen direct tax mobilisation to achieve a more balanced and equitable tax mix.
The more important question is how policymakers will shape the next phase of tax reform. As Sri Lanka’s revenue position strengthens, attention is likely to shift from simply raising revenue to improving the balance and fairness of the tax system
Equity challenge
The Government deserves credit for implementing extensive tax reforms, strengthening administration, expanding VAT registration, introducing risk-based audits, digitalising tax systems, and improving compliance. These measures have undoubtedly strengthened fiscal sustainability.
However, equity considerations cannot be ignored. Many households continue to face high living costs, while indirect taxes are embedded in the prices of everyday goods and services.
A sustainable tax system must be judged not only by how much revenue it raises but also by how fairly that revenue is raised. Adam Smith made the same case in 1776, arguing that “the subjects of every State ought to contribute towards the support of the Government, as nearly as possible, in proportion to their respective abilities.”
A more equitable distribution of the tax burden would reduce excessive reliance on consumption taxes and align Sri Lanka more closely with a tax structure that promotes both fiscal sustainability and fairness
Conclusion
Sri Lanka’s fiscal recovery is one of the most significant policy achievements in recent history. Tax revenue has increased dramatically, fiscal deficits have narrowed, and the country has regained a degree of macroeconomic stability. These gains should be acknowledged and preserved.
Yet the composition of tax revenue tells a more nuanced story. The burden of revenue mobilisation is increasingly being borne by indirect taxes, with direct taxes accounting for less than one-quarter of total tax collections in 2025. The resulting direct-to-indirect tax ratio of 1:3.4 raises legitimate concerns about fairness, progressivity, and the long-term quality of Sri Lanka’s tax system.
The challenge for the next phase of reform is therefore not simply to collect more revenue. It is to ensure that future revenue growth comes from a tax structure that is both efficient and equitable—one that preserves fiscal stability while distributing the tax burden more fairly across society.
Sustaining Sri Lanka’s revenue gains without deepening inequality will require the reverse of 2025’s pattern — widening the direct tax net through better compliance and administration, rather than repeatedly reaching for the VAT and excise levers whenever revenue needs to rise.
(The views expressed in this article are those of the author in her personal capacity)
Note:
Reference has been made to Ministry of Finance, Planning and Economic Development, Sri Lanka — Final Budget Position Report 2025, Chapter 4 “Government Revenue” (Table 4.1, Figure 4.1, Figure 4.2, and accompanying text); OECD, Revenue Statistics in Asia and the Pacific 2026 (Table 4.32 “Sri Lanka: Details of tax revenue” and Figure 1.13 “Average tax structures for Asia-Pacific, Africa, LAC and OECD, 2024”).