Friday Oct 09, 2026
Friday Oct 09, 2026
Friday, 9 October 2026 00:20 - - {{hitsCtrl.values.hits}}
The Government’s decision to scrap two of the three schemes which allow rooftop solar energy systems to connect to the national electricity grid has caused shock waves and weakened new installation demand. Before deciding whether that change is justified, it is worth understanding how rooftop solar became so important — and what it now does to the electricity system.
The Public Utilities Commission of Sri Lanka (PUCSL) reports that rooftop solar reached 2,472 MW of installed capacity by 31 December 2025: 2,120 MW connected through CEB and 352 MW through LECO. Using PUCSL’s consumer rule of thumb of 115–120 kWh of monthly generation for each installed kW, a mature 2.5 GW rooftop fleet would produce roughly 3,450–3,600 GWh a year, or about 9.5–10.0 GWh on an average day. (This is a run-rate estimate, not reported 2025 generation: PUCSL records 1,938 GWh of rooftop generation in 2025 while capacity was still growing rapidly during the year.)
How rooftop solar took off
Rooftop solar now makes up 19.4% of Sri Lanka’s total electricity generation. In other words, one fifth of our electricity now comes from solar power on people’s roofs, a clean, renewable source of energy with no capital cost burden on the Government. This is also 56% or just over half of our annual hydroelectricity generation of 6,306GWh as reported by PUCSL for the year 2025.
The Government facilitated solar roofs by allowing “net metering” which allows the electricity utilities, CEB (Now called NSO-National System Operator) and LECO customers to set off electricity exported against electricity imported, paying only the difference if there is a deficit and receiving an “electricity credit” if export is more than import. Net metering became Government policy thanks to the efforts of a few dedicated individuals including the late Herath Dissanayake who sadly passed away last month. This scheme was further expanded to include “net accounting” where any exported electricity after the electricity “set off” received a payment from the utility and “net plus” which kept export and import separate, paying for imported electricity while obtaining payment for export. The initial rate for electricity payment also called the “feed in tariff” was calculated on an ad hoc basis and later by a comprehensive formula developed later by the electric utility’s own whiz kids. Despite initial objection, this formula was accepted as a fair solution for the feed in tariff calculation. The fair and transparent feed in tariff, increasing electricity prices, falling solar module and inverter prices, became the formula for rapid expansion. Sri Lanka’s own entrepreneurs stepped in utilising decades of human seed capital from a massively successful rural solar program of the last decade. Finally the nearly unlimited financial resources of our wholesale importers also joined in, and the industry mushroomed creating nearly a thousand small solar companies and tens of thousands of foot soldiers, for sales and installation work. The big names too joined the fray bringing their access to capital, distribution channels and name brands to bear. Retail banks joined in with an Asian Development Bank(ADB) refinance scheme. The result was massive capacity increase and growth of the industry. The industry associations claim that the industry has 1000 active solar companies with 40,000 are direct employees.
Two events that changed the debate
Monkey business – The February 2025 blackout
On a sunny Sunday in February 2025, the entire national electricity grid went down and it took much of the day to restore. Naturally everyone looked for a culprit and initially the monkey that apparently caused the short circuit was blamed. Then the blame shifted to rooftop solar. The theory that took hold was that there was simply too much solar on the grid and that rooftop solar had made the system unstable. This has subsequently become one of the arguments used to justify curtailing rooftop solar. But what actually happened is much more interesting.
The fault occurred at the Panadura grid substation at around 11.13 a.m. It was a sunny Sunday; electricity demand was low and rooftop solar was supplying a very large part of daytime demand. This meant that the national grid was seeing only the balance of the electricity being consumed in homes and businesses, after their rooftop solar generation had been deducted. When the Panadura fault occurred, voltage in the surrounding network dropped sharply and a quantity of rooftop and other embedded solar automatically disconnected to protect itself. The fault itself was cleared very quickly and system voltage recovered to normal in about one second. The problem was that the solar which had disconnected did not come back with it. 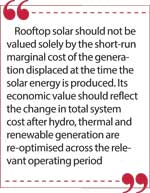
A simple example explains what happened. Imagine an area consuming 100 MW of electricity but producing 60 MW from rooftop solar. The national grid only has to supply the remaining 40 MW. If a disturbance causes that 60 MW of solar disconnect, when the voltage recovers the consumers still require their 100 MW, but the solar is no longer there. The national grid which was supplying 40 MW suddenly must find 100 MW. This is not just theory. Measurements following the Panadura fault showed that power flowing into the affected area increased by about 25 MW after the fault was cleared, consistent with embedded solar generation having disconnected.
Rooftop solar inverters were required to wait 60 seconds before reconnecting to the grid. The grid therefore recovered almost immediately, while the solar generation it had been relying on remained absent for at least another minute.
The effect was immediate. Electricity which only moments earlier had been supplied locally by rooftop solar now had to come from the national grid. Measurements on the transmission lines serving the affected area showed power flowing into it increasing by about 25 MW after the fault was cleared. But this was only what could be observed on those particular transmission lines. It does not tell us how much solar generation may have disconnected across the wider Western Province, where rooftop solar is heavily concentrated, or elsewhere in the country.
The system was therefore suddenly faced with a very different balance between supply and demand. Conventional generators had to pick up electricity which, seconds earlier, had been supplied by solar. Frequency began to fall. As it fell, more solar inverters elsewhere disconnected on their protection settings. Each additional loss of solar increased the amount of electricity the conventional generators had to supply, pushing frequency still lower. What began as a local electrical fault was becoming a national problem.
The automatic load-shedding system then operated, but here another consequence of the growth of rooftop solar became apparent. The system had been designed for an electricity network in which switching off a distribution feeder removed roughly the amount of consumer demand carried by that feeder. That was no longer necessarily true. By 2025 many feeders contained substantial rooftop generation as well as consumption. Disconnecting such a feeder therefore removed both the remaining demand on the national grid and the solar generation embedded within it. The actual relief to the grid could consequently be much smaller than expected.
The downward spiral continued. At 11:13:58 New Laxapana tripped on under-frequency protection. Within milliseconds Samanalawewa, Old Laxapana, Uma Oya and Victoria followed. Shortly afterwards the three operating units at Norochcholai also tripped. Less than half a minute after the original fault at Panadura, the national grid had collapsed.
The important point is that rooftop solar did play a part in the blackout, however it did not cause it nor is it fair to say that we have too much solar and it had made the grid unstable. It’s true that a large amount of solar is now operating on the grid, the monitoring, protection and operating arrangements have not kept pace with it.
The Engineers’ plus, plus
The second event of significance to the industry was a new scheme launched in 2024 by the utility companies, called “net plus plus”. The origin of this scheme remains a mystery as the industry never requested it and it is suspected that a group of engineers within the electricity utility itself created it. This scheme completely removed the link between the customers’ contract demand and the size of the rooftop solar system they could install. (30A single phase - 5 kW, 60A three phase - 20 kW, 60A three phase – 40 kW) Under the net plus plus scheme all that was needed was the area engineer’s approval to install the largest 40 kW system even on the smallest house.
The scheme also separated the utility customer/roof owner from the actual developer, allowing investors to take advantage of someone else’s roof space anywhere in the country to install a system, in fact even roof space was not a limiting factor with massive solar arrays being installed on tiny roofs became a common sight.
This scheme became a windfall for many “investors”.
At the peak Rs.37/kWh feed-in tariff, a 40-kW system producing about 5,000 kWh a month would earn roughly Rs.185,000 a month. On an investment of about Rs.4.5 million, the simple first-year cash yield is about 49%, with a simple payback of just over two years before allowing for degradation, maintenance and inverter replacement. The fast-growing solar industry accelerated even further as opportunistic investors rushed to benefit from this windfall scheme. Finally, when it dawned on the authorities that the scheme was being abused, it was suddenly scrapped.
The bigger picture
So why did the Government scrap “net metering” and “net accounting” schemes leaving only the “net plus” scheme which makes customers buy electricity from the utilities at a high price while selling the solar electricity at a lower price. A scheme that makes no economic sense to a household.
The Government claims that around 85,000–90,000 rooftop solar customers under Net Accounting are benefiting financially at the expense of around 7 million electricity consumers.
In other words, the Government is saying that we lose money buying electricity from solar roofs during the day while supplying high-cost thermally generated electricity at night when solar is not available.
Is this correct?
The assumption that solar generation during the day is more expensive to the Government is fundamentally flawed. The now significant rooftop solar generation of around 9.7Gwh per day has effectively pushed the daytime hydro generation to the nighttime minimising thermal generation use. (see table and graph below)
Sri Lanka: Shift of major hydro to the evening peak
March 2020–2025 dispatch comparison and March 2025 hydro-battery headroom
Method: average 15-minute Major Hydro dispatch for comparable weekdays during 1–17 March of each year. Midday is 10:00–15:00 and evening is 18:30–22:30. The 2025 sample is limited to the PUCSL March data available through 17 March.
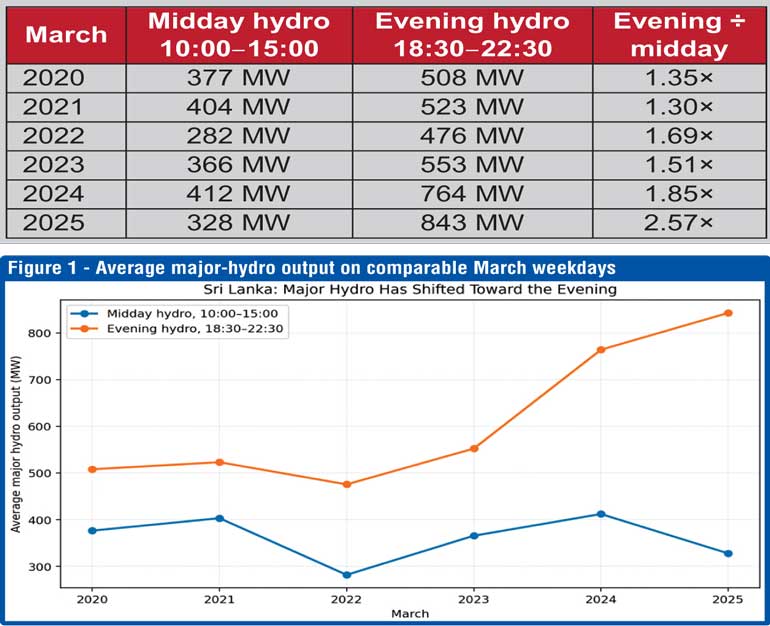
Figure 1. Average major-hydro output on comparable March weekdays.
What the shift shows
The evening-to-midday hydro ratio rose from about 1.3× in 2020–21 to 1.85× in 2024 and 2.57× in early March 2025. This is consistent with reservoir hydro being backed down during solar hours and conserved for the evening ramp. The timing coincides with rapid rooftop-solar growth, although rainfall, reservoir conditions, demand and thermal-plant availability also affect hydro dispatch.
PUCSL Daily Solar and Hydro Generation - 18 March 2025
The PUCSL daily report provides a useful visual cross-check of the dispatch analysis. On 18 March, major hydro falls to roughly 150-200 MW around the middle of the day, then rises sharply as solar output declines, reaching roughly 1,100 MW around the evening peak. The solar chart shown by PUCSL is based on telemetered solar stations only; it therefore does not show the much larger behind-the-meter rooftop-solar contribution.
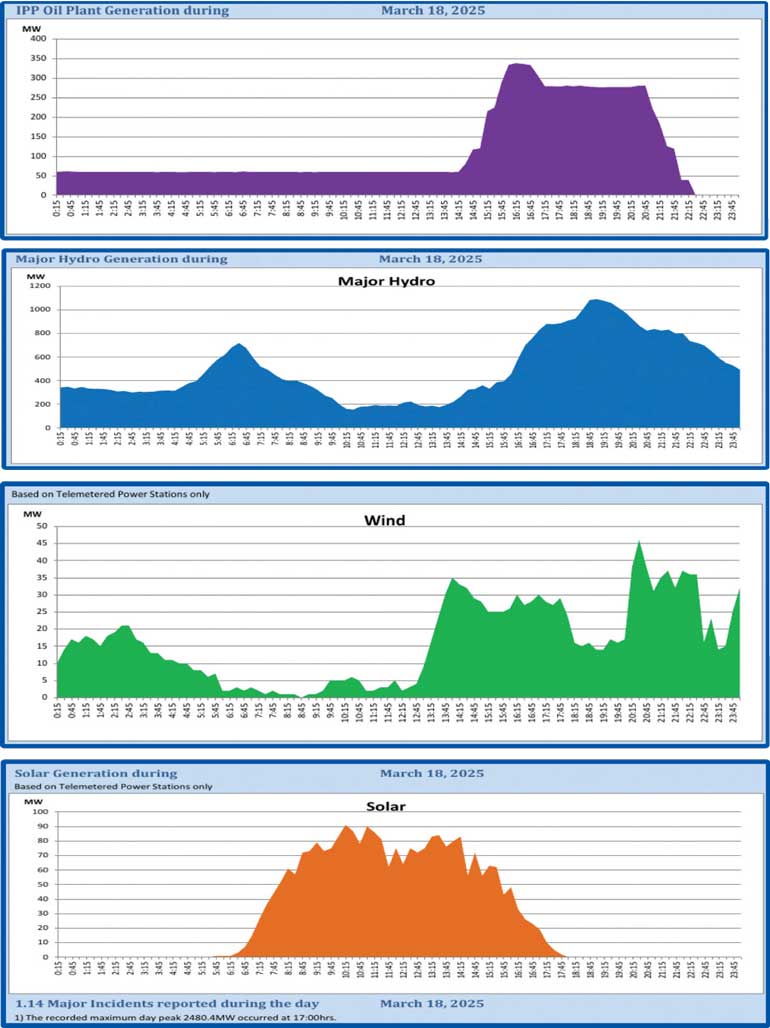
This is a tremendous windfall for the NSO and the country which should use this information to recalculate its actual cost of nighttime generation. This phenomenon is in effect like the pump storage systems adopted by many countries to store solar energy by pumping water back into reservoirs to use at night. Thanks to our massive hydro network and a dynamic solar industry, we are saving water during the day to use for hydro generation at night pushing out expensive thermal generation. We have achieved this serendipitously. It is unfortunate that decision makers can’t see the gift they have received!
The installation of grid batteries or BESS (Battery Energy Storage Systems) will further improve this shift to the nighttime by storing more solar energy for nighttime use displacing even more thermal generation and eventually even eliminating it.
The Transformation Already Underway
Sri Lanka’s electricity generation mix, 2020-2025
The scale of the change in Sri Lanka’s electricity system is easily overlooked. Figures provided by the utilities themselves show just how dramatically the generation mix has changed in only five years.
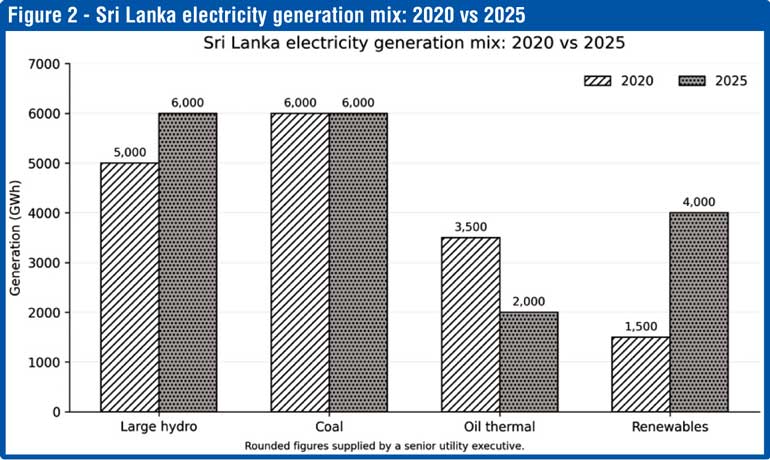
The 4,000 GWh of renewable generation in 2025 comprised approximately 3,000 GWh of solar, 800 GWh of wind and 200 GWh of biomass.
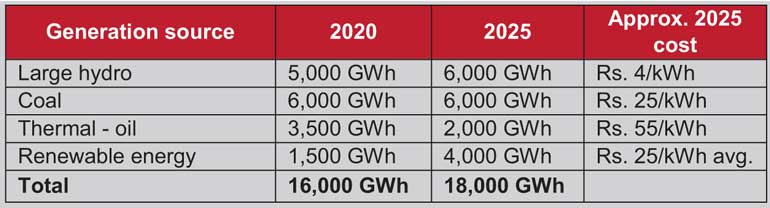
Figure 2. Sri Lanka electricity generation mix: 2020 vs 2025.
These figures tell an important story. Between 2020 and 2025 electricity generation increased by about 2,000 GWh, but coal generation remained virtually unchanged. Renewable generation, on the other hand, increased from 1,500 GWh to 4,000 GWh - an increase of 2,500 GWh, or 167%. At the same time expensive oil-fired generation fell from 3,500 GWh to 2,000 GWh.
That reduction matters. Oil-fired electricity costs approximately Rs. 55 per kWh, compared with an average purchase price of around Rs. 25 per kWh for renewable energy. At these stated prices, the 1,500 GWh reduction in oil-fired generation represents an indicative difference of:
1.5 billion kWh x (Rs. 55 - Rs. 25) = approx. saving of Rs. 45 billion per year
It would be too simplistic to say that every unit of additional renewable energy directly displaced a unit of oil generation. Hydro generation also increased during the period and the generation mix varies according to rainfall, demand and plant availability. But the direction of travel is unmistakable. Sri Lanka produced considerably more electricity in 2025 than in 2020 while using 1,500 GWh less of its most expensive oil-fired generation. The enormous expansion of renewable energy, principally solar, has been central to making that possible.
The demand ahead
The utility’s forecasts electricity requirements increasing from approximately 18,000 GWh today to 22,000 GWh by 2030 and 36,000 GWh by 2040. That means Sri Lanka will have to find another 4,000 GWh within the next few years and another 18,000 GWh by 2040 - effectively doubling today’s electricity supply. These forecasts are based on existing growth and do not take into account a major shift towards electrification of transport and cooking.
That raises an obvious question. If solar has already helped Sri Lanka reduce its dependence on Rs. 55/kWh oil-fired electricity, and the country will require twice as much electricity by 2040, should our priority be to slow down solar - or to redesign the electricity system so that we can use much more of it?
Source note: Generation, cost and forecast figures are rounded figures. The Rs. 45 billion figure is an illustrative calculation based on those rounded figures, not an audited utility saving.
It is also the sustainability of industry which will eventually take solar to even the lowest income households, as there are less and less high-income households, the industry will innovate, lower costs and reduce entry barriers to reach lower income households get access to free energy from the sun. (Like the penetration of mobile phones and smart phones to all income levels) Killing the industry now will ensure that only the high-income groups will continue to benefit from solar.
What should our policymakers do? They should question the NSO and PUCSL on exactly how solar is being costed. If the NSO says that daytime solar is displacing hydro costing around Rs.4/kWh, but in reality, solar allows that hydro to be conserved and used during the nighttime peak, where it can displace oil-fired generation costing around Rs.55/kWh, the value of 9.7 GWh of solar changes from Rs.38.8 million to Rs.533.5 million per day. That is a difference of almost Rs.495 million a day. This is an enormous difference and, if our policymakers don’t get this calculation right, it will come back to haunt them.
They should also question the grid stability argument. How exactly is rooftop solar causing grid instability? Is the problem solar itself, or is it the NSO’s inability to adequately monitor rooftop generation and develop the protection systems and operating protocols required for a grid in which solar now plays such a major role? The February 2025 blackout suggests that this distinction matters.
Rooftop solar should not be valued solely by the short-run marginal cost of the generation displaced at the time the solar energy is produced. Its economic value should reflect the change in total system cost after hydro, thermal and renewable generation are re-optimised across the relevant operating period.
(The author is a pioneer solar energy entrepreneur, a former member of the Colombo Municipal Council, Sri Lanka Consul General to Germany and a former Director of LECO)