El Niño and food inflation in Sri Lanka: What history tells us

Friday, 20 November 2026 00:28 -     - {{hitsCtrl.values.hits}}


  •  Historical evidence suggests that the effects on food prices may take time to emerge, making rainfall, crop conditions, and market supplies worth watching

El Niño 2026/27: Outlook for Sri Lanka


The Department of Meteorology’s outlook1 indicates that El Niño may persist into early 2027 and peak towards the end of 2026. Above-normal rainfall is possible during November–December 2026, followed by a greater risk of drier conditions and higher temperatures between February and April 2027. On this background, this article examines three strong historical El Niño episodes identified by the Department of Meteorology using the Relative Oceanic Niño Index (RONI):2 1982/83, 1997/98 and 2015/16. 


Rainfall before drought: An important part of the story


An important feature observed across the three historical El Niño episodes is that the drought conditions, which were generally identified during Jan–Apr, were preceded by relatively heavy rainfall during Oct–Dec of the preceding year. This highlights the importance of examining rainfall patterns not only during drought periods but also in the months leading up to them. This observation is consistent with Sri Lanka’s seasonal rainfall pattern. On a national average,3

 rainfall is generally higher during Sep-Dec than during Jan-Apr and Mean temperatures also tend to be relatively high during Mar–May. These seasonal patterns provide important context for understanding the potential effects of El Niño.

During the identified drought months, country-average rainfall was 91% below normal in February 1983, 70% below normal in March 1998 and 51% below normal in April 2016. While the extent of rainfall deficits varied across the three episodes, understanding their potential implications for food prices requires examining not only the drought periods themselves, but also the rainfall conditions in the preceding months. Excessive rainfall during these months can also damage crops and create post-harvest losses as well as transportation and distribution losses, potentially adding to food-price pressures.


When did inflation respond?


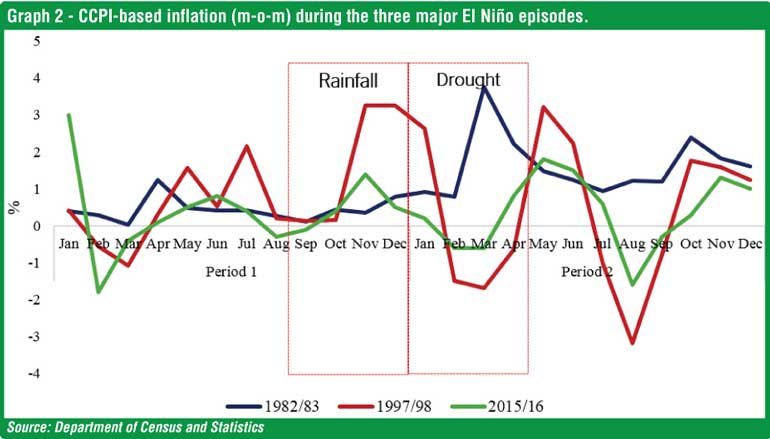
Month-on-month (m-o-m) inflation is examined to identify short-term price movements around periods of rainfall deficiencies and assess how quickly these movements may be reflected in consumer prices.


In each episode, the highest m-o-m inflation within the period examined occurred one to two months after the month with the largest rainfall deficit. In 1982/83, m-o-m inflation reached 3.76% in March 1983, following the February largest rainfall deficit. In 1997/98, it reached 3.22% in May, following the March largest deficit. In 2015/16, it reached 1.80% in May, following the April largest rainfall deficit. M-o-m inflation also remained relatively elevated during the following three months after the drought, with average m-o-m inflation rates across the episodes ranging from about 1.3% to 1.6%. 

The timing suggests a possible delay between rainfall deficits and price increases, but does not prove a direct causal link. Inflation is also affected by demand, fuel and other commodity prices, exchange rates, seasonal factors and wider economic conditions. Comparisons are further limited because the CCPI series use different base years and consumption baskets. Historical patterns therefore indicate a potential risk, not a definite prediction for 2026/27. The historical comparison is most useful for identifying timing and possible pressure points, rather than predicting a particular inflation rate.

Headline inflation covers a broad range of goods and services; food inflation focuses on food prices. Looking at food inflation separately helps show how food prices moved around periods of rainfall deficiency.


Food prices at the centre of the response


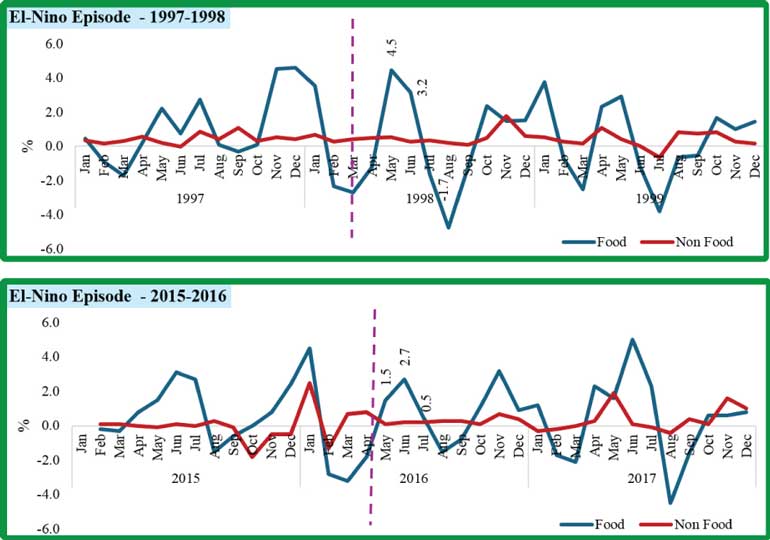
Graph 03: CCPI-based food and non-food inflation (m-o-m) during the 1997/98 and 2015/16 episodes.


Note: The vertical line marks the peak drought month. Source: Department of Census and Statistics

The food and non-food m-o-m inflation series for 1997/98 and 2015/16 suggest that food prices accounted for much of the increase following the identified peak drought months. Over the next three months, average m-o-m food inflation was 2.17% in 1998 and 1.57% in 2016, giving a combined average of 1.87% for the two episodes.

The magnitude of price increases differed between the two episodes. The impact on food prices would have depended on several factors, including the crops affected, the timing and duration of supply disruptions, and the availability of market stocks.


How did selected food prices respond to the 2015/16 El Niño episode?


The movements in selected food subgroups in the Colombo Consumer Price Index (CCPI) during the 2015/16 El Niño episode provide further insights into food-price developments during this period.

Some of the graphs illustrate changes in the cost of fixed baskets of selected food subgroups, reflecting overall price movements within each group rather than changes in individual food items.

These movements may also have been influenced by other weather conditions and economic factors prevailing at the time. Accordingly, the analysis highlights possible food-price responses associated with the 2015/16 El Niño episode, rather than establishing a direct causal relationship.

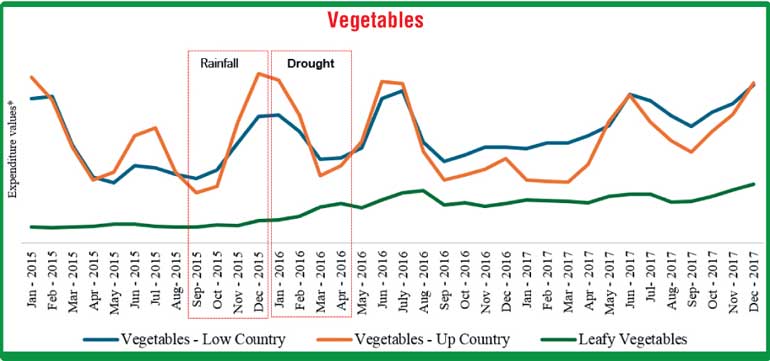
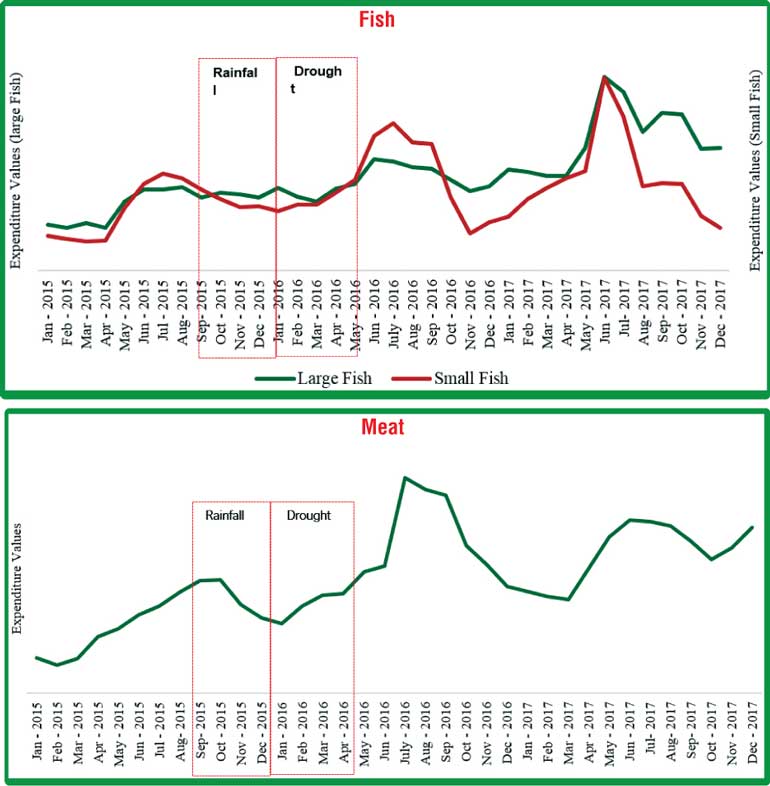
Graph 4: Potentially Quicker Price Responses: Vegetables, Fish and Meat.


*Note: Expenditure values represent the estimated cost of the respective consumer baskets based on CCPI weights. These are not displayed, as the analysis focuses on price trends and relative movements over time.

Vegetable prices appear to have been affected by both rainfall and drought conditions. Increases following heavy rainfall were particularly pronounced in up-country vegetables, while low-country and leafy vegetables showed more noticeable increases following the dry spell.  A similar pattern was observed in January 2015, when prices of both low- and up-country vegetables surged following the heavy rainfall in December 2014.

The increases observed from May to July 2016 were also larger or more persistent than those in the corresponding months of 2015 and 2017, suggesting that seasonal influences alone may not fully explain the price movements.


Fish prices recorded notable increases following the dry spell, with the movements being more pronounced in small fish than in large fish during the first three months after the identified drought period. This may partly reflect changes in marine environmental conditions associated with El Niño, which could affect fish availability. A recent bulletin issued by the Indian National Centre for Ocean Information Services (INCOIS) indicates that El Niño-related warming in the Indian Ocean could place marine ecosystems under thermal stress, potentially affecting the distribution and recruitment of small pelagic species, particularly sardines and mackerel, and thereby influencing catches.
Although prices of both small and large fish typically show seasonal movements between May and July, the magnitude and pace of the increases observed in 2016 were noteworthy compared with the corresponding periods in 2015 and 2017. 

Meat prices also increased during the post-drought period, potentially reflecting a shift in demand towards meat as an alternative to fish. Particularly noteworthy was the sharp increase between June and July 2016, which was considerably higher than the movements observed during the corresponding months of 2015 and 2017. Higher animal feed costs and shortages of water may also have

contributed by raising livestock production costs.


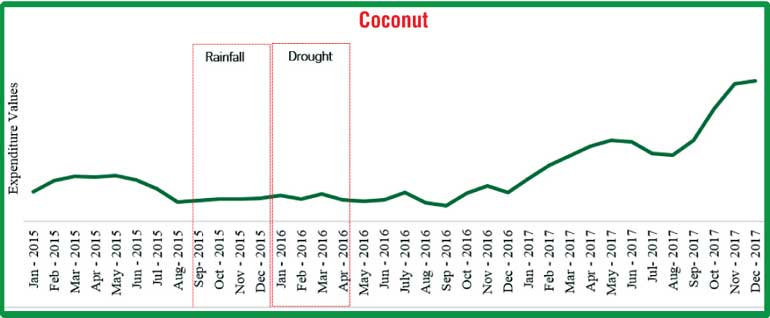
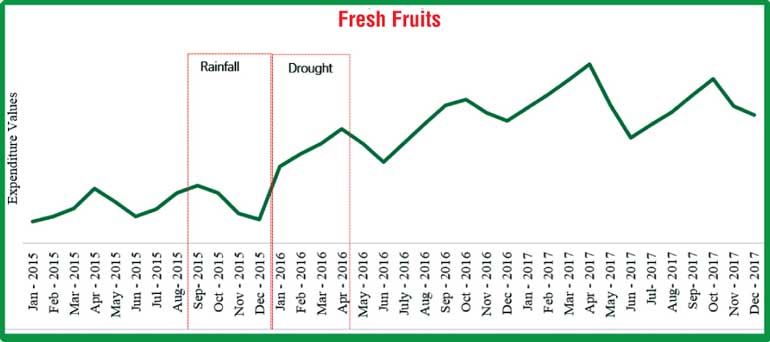
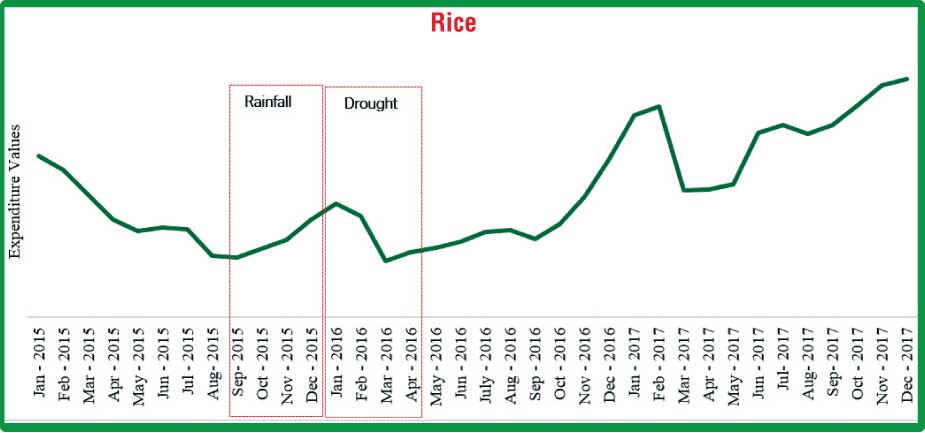
Graph 5: Potentially Delayed Price Responses: Rice, Coconut and Fresh Fruits 


The response also differed across commodities, with some taking longer to reflect weather-related pressures. Rice prices recorded a more noticeable increase from October 2016, suggesting a possible delayed response to the dry spell. The Maha season may have been relatively less affected due to water availability, while the subsequent Yala cultivation could have faced greater challenges from drought conditions. Any delays in sowing and planting may also have affected the timing of harvesting and market supplies, contributing to the later increase in rice prices. However, these remain possible explanations, as the price data alone do not establish whether Yala cultivation was affected or whether farmers delayed planting. Production cycles, harvesting schedules, existing stocks, storage and the availability of supplies may all influence how quickly weather-related disruptions are reflected in consumer prices.


Coconut prices showed an overall upward trend from December 2016 onwards, despite marginal setbacks during some months. This sustained increase, particularly during 2017, may reflect delayed effects of El Niño-related weather conditions or rainfall patterns preceding the event. Research on Sri Lanka’s coconut sector also suggests that adverse weather conditions may affect coconut supply with a considerable time lag of around ten months to a year (Silva & Matsui, 2026). 

Fresh fruit prices also recorded a considerable increase during the 2016 drought period. Notably, the magnitude of this increase was greater than the movements observed during the corresponding period in 2015 and 2017. This suggests that, beyond normal seasonal fluctuations, the dry conditions may have contributed to the price pressures observed in fresh fruits during this period.


Source: Department of Census and Statistics 

Taken together, the subgroup evidence points to three important features of the 2015/16 episode: price increases in several vegetable and fish categories emerged after the dry spell had persisted for several months; the timing and magnitude of the movements varied across commodities; and some categories, notably rice and coconuts, recorded more noticeable increases later. Overall, the timing and magnitude of price movements differed across the selected food subgroups. These differences may reflect crop cycles, harvesting patterns, seasonal availability, storage, transport and other supply-side developments. While the observed movements provide useful insights into food-price developments during the 2015/16 episode, they do not independently establish the extent to which El Niño-related weather conditions contributed to the changes.


Lessons from history and the inflation outlook


The historical evidence highlights that food-price developments may be influenced not only by drought conditions but also by rainfall patterns in the preceding months. Food prices accounted for a significant part of the inflation response, although the timing and magnitude of the increases varied across commodities. These historical patterns highlight potential pressure points but do not imply that inflation will follow the same path during the 2026/27 episode.

Sri Lanka’s economic environment has also changed. Expenditure values are estimated to be around three times higher than in 2015/16, this does not necessarily indicate greater household purchasing power, as constrained budgets may limit households’ ability to absorb further price increases.

Monitoring rainfall forecasts alongside crop conditions, vegetable arrivals, fish landings and wholesale and retail prices can help identify food-supply pressures early. History offers lessons about possible risks, not a definitive prediction for 2026/27. The outcome will depend on the severity and duration of weather disruptions and on wider economic conditions and policy responses.

These weather-related risks are emerging at a time when headline inflation has already moved above the 5% inflation target due to several supply-side pressures, including adjustments to energy prices reflecting changes in international fuel prices, partly influenced by geopolitical conflicts, as well as other domestic and external cost pressures.

Sri Lanka reaffirmed its 5% headline inflation target for the next three years in October 2026. The Central Bank of Sri Lanka has also reiterated its commitment to price stability through its Monetary Policy Reviews, emphasising its readiness to take timely and appropriate measures to stabilise inflation around the target while supporting economic activity over the medium term.

Disclaimer: The views and opinions expressed in this article are those of the author in his personal capacity and do not necessarily reflect the views or official position of the Central Bank of Sri Lanka. The analysis is intended for informational and discussion purposes and should not be interpreted as an official forecast or policy statement of the Central Bank.


(The author is a Senior Assistant Director, Statistics Department, Central Bank of Sri Lanka)


1. Asia Pacific Alliance for Disaster Management (APAD). (2026). El Niño 2026/27 Weather Outlook Update 001, 12 October 2026.

2. In February 2026, the US National Oceanic and Atmospheric Administration’s Climate Prediction Center adopted RONI as its operational index for monitoring and classifying El Niño and La Niña.

3. Source: World Bank Climate Change Knowledge Portal, Sri Lanka – Historical Climate Data (1991–2020 climatology), based on Climatic Research Unit (CRU) observations.

Recent columns

COMMENTS