Friday Jul 03, 2026
Friday Jul 03, 2026
Saturday, 2 May 2020 00:03 - - {{hitsCtrl.values.hits}}
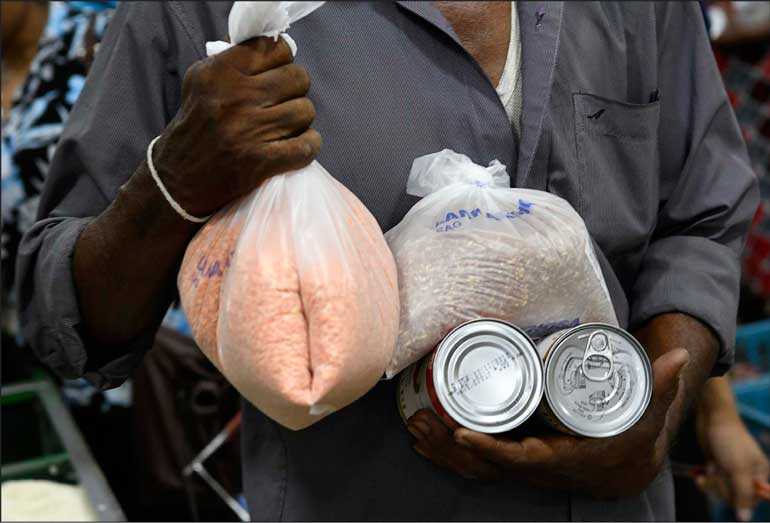
It is clear that very many low-income Sri Lankan households are in dire difficulty with the continuing COVID-19 lockdown and they need urgent income-support. It is the responsibility of the Government to arrive at a workable solution given multiple options available – Pic by Shehan Gunasekara
' 1.0 Executive summary
The cost of the nationwide COVID-19 lockdown of five weeks and counting is causing tremendous hardship for low-income Sri Lankans.
Households in the five lowest income deciles are the hardest hit. Due to the inconsistency of income streams of breadwinners in these households and inelastic nature of basic expenditure, their budgetary gaps have become significant even after adjusting for spending cuts wherever possible. The Government must provide income-support for these households that include an estimated four million workers.
The proposed package would cost approximately Rs. 45.5 b ($ 233 m). Part of this amount can be financed through specific COVID-19 support from multilateral financial institutions or expected debt suspension while part of it can be long-term concessionary loans via the domestic financial system. The duration of support cannot be estimated with the available data and will depend on how long the lockdown will remain and what the rate of normalisation will be. That will become clear in the coming days.
2.0 Objective
The objective of this short essay is two-fold. First is to provide a realistic assessment of the massive impact the economic fallout of COVID-19 will have from a household economy perspective; particularly, low-income families. The second is to propose an adequate income-support program while providing possible financing options.
Both must be considered in the short term until the economy is able to bounce back in the medium term.
3.0 Many Sri Lankan households were in trouble before COVID-19 hit
The uneasy truth about the household economy of Sri Lanka is that most families are struggling to make ends meet. While not admitting openly, many families struggle to put enough food on the table and take care of their children. This was true prior to COVID-19. What the pandemic has done is exacerbate the already difficult situation.
The table from the latest available (2016) Household Income and Expenditure Survey (HIES) of the Department of Census and Statistics (DCS) indicates that the monthly household income of half of our families (lowest five deciles by income) were, on average, inadequate to meet their monthly expenses. A comparison of the mean household income and mean household expenditure illustrates this unfortunate reality.
What this table shows is that 50% of households; that is the bottom five deciles earning up to an upper limit of Rs. 43,500 a month (in 2016) could not, on average, make ends meet with their regular income. For example, the lowest income decile was, on average, short almost by Rs. 10,000 a month (difference between mean expenditure of Rs. 19,561 and mean income Rs. 9,916) while the fifth decile, was on average short by about Rs. 1,000 a month. It is only the highest income decile who seem to have a significant amount left over after household expenses. And this is not surprising as the richest 20% enjoy 51% of total household income while the poorest 20% only gets 5%.
4.0 Households income and expenditure patterns and their indebtedness
To understand how income and expenditure is categorised it is necessary to note that HIES includes both monetary and non-monetary components as income. That means monetary income comprises of salaries (38%), income from agricultural activities (8%), non-agricultural (17%), other cash income (13%) and ad-hoc receipts (9%) while non-monetary income includes value of rent if occupying own home (10%) and value of home-grown agricultural produce and all in-kind income (5%). Expenditure on the other hand is broken down by food expenses (35%) and non-food (65%). The major non-food components include housing (19%), transport (12%), loan payments (11%), personal care and health (7%), education (6%), durables (6%), etc.
Another important issue to be considered is the level of indebtedness of our household economy. According to the same study, 60% of Sri Lankan households were in debt; urban at 50, rural at 61 and estate at 73% respectively. The most indebted families were in Vavuniya (81%) perhaps due to the absolute harsh post-war reality while Polonnaruwa (78%) and Matale (72%) perhaps due to volatility in agricultural income.
The mean household debt per indebted household was Rs. 428,000 to leasing or finance companies, Rs. 338,000 to banks, Rs. 230,000 to place of work and Rs. 225,000 to money lenders and pawn brokers and so on. Most households had taken out loans for either building or repairing their dwelling, for consumption, to start or expand a business activity or to purchase a durable, in that order. The bottom line is that not only are our low-income families facing challenges in meeting their daily expenses but are fairly indebted claiming a stake on future income as well.
So, this was the pre-COVID-19 old-normal as it stood in 2016. The situation could have improved somewhat until 2020 in real terms given the sharp increase in salaries in the public sector in the last couple of years while wages in the informal private sector also increasing. The just released Annual Report of the Central Bank for 2019 indicates overall increase in public sector salaries for the last two years was 4.9%, for private sector wages boards 3.5% and for informal private sector the increase was 19.4%. But expenses would have also increased inline.
So, let us assume the 2017 situation as good a proxy we can get for the immediate pre-COVID-19 situation in real terms. However, in nominal terms, using consumer price inflation (CPI) for 2018 and 2019 would give us a sense of LKR figures that is meaningful in terms of calculating necessary relief measures. Assuming CPI at 5% for each year since mid-2017 we could adjust all figures by 15% to reflect nominal prices (income, expenditure, debt, etc.) to reflect the current mid-2020 situation.
5.0 Impact of the COVID-19 lockdown on households
Let us now consider the post-COVID-19 situation to assess in a very broad sense how Sri Lankan families could be impacted. First, consider the income side of the equation. According to the 4th Quarter Labour Force Survey of 2019 of the DCS, just over 8.2 m Sri Lankans were in employment; 2.2 m in agriculture, 2.2 m in industry and 3.8 m in services.
In agriculture almost all are farmer families with about 400,000 of them working without any remuneration; referred to as contributing family workers. Outside agriculture; that is in industry and services, four million were employed (1.2m by the State and 2.8 by the private sector), 1.6 m were self-employed, some 175, 000 were employees, meaning entrepreneurs with at least one employee and 200,000 contributing family workers.
Another meaningful way to segment the labour force is that, of the 8.2 m employed only about three million receive a monthly salary while 2.6 m get remunerated based on the success of their self-employment venture be it farming or running a food cart or driving a three-wheel taxi, etc. and 1.7 m are daily wage workers such as labourers, construction workers, daily domestic helpers and so on. Of the 8.2 m, 600,000 do not get paid as explained earlier.
6.0 Lockdown impacts both supply and demand
The COVID-19 economic impact is felt on both the supply side as well as the demand side. On the supply side, factories, hotels, shops and offices are closed due to lockdowns and self-employed and daily wage workers are unable to engage in their trade as markets are closed and transport is restricted. On the demand side people are at home so there are no customers, no tourists, no shoppers and no passengers.
Most of Sri Lanka has been in complete lockdown for some five weeks with only absolute essential services in operation such as healthcare, security and law enforcement. In recent days some relaxation took place in terms of reopening factories outside of high-risk areas with daytime lockdown removed in 21 of 25 districts allowing 14.8 m out of 21.8 m population limited access beyond the immediate confines of one’s home. But as at tonight (30 April) the entire country will once again go into a complete lockdown due to unexpected rise in identified COVID-19 cases. In fact, valid questions are being raised with regard to the cost-benefit of the long lockdown given the significant rise in the number of new cases instead of a sharp fall of new cases.
During the lock down it is true that some market exchanges are taking place online with physical delivery offline; particularly groceries, food and medicine. Some amount of services is also traded online; education, entertainment and corporate meetings and such. However, the extent of such activity has not been measured, but at the moment such would be marginal, in terms of the huge negative impact of the physical lock down.
7.0 The varying negative impact by type of employment and income
The only category that will not be impacted in terms of income are State employees. The 1.2 m workers of various Government institutions and uniformed services will continue to draw monthly salaries. Perhaps the only loss would be their overtime and other allowances as applicable.
Of the 1.8 m remaining monthly salary earners in the private sector, some would not be impacted; I presume they would be in essential services particularly in health care. It is likely that most others would have some negative impact on their monthly earnings; ranging from a very heavy toll in tourism related jobs to marginal toll in strong financial institutions. Most others; be it in apparel, trading, construction or banking would have to renegotiate their contracts in some way or the other explicitly or implicitly immaterial of the existing rigid labour legislation.
Next category will be employers; the 220,000 business owners who employ others. Here again, the impact will be relative to exposure to the worst affected to least affected sectors they are operating in. An owner of a small software company employing few technical staff operating crucial online services to a big telco would have no impact, perhaps even greater demand, but an owner of an export apparel manufacturing plant employing several hundred staff supplying fashion clothing may have to fold up with no orders and unsustainable fixed costs. Here both the owner and the monthly salaried worker will be severely impacted.
Then consider the small entrepreneur or the self-employed person who does not employ anyone else. Here again, the impact will be sector specific. A paddy farmer in Polonnaruwa will certainly be less effected than a rice-packet seller in Bambalapitiya or a three-wheeler driver in Hikkaduwa. A dentist running an independent practice will see lower loss of relative income than an independent tour guide and so on. But given the large number of persons who are self-employed; 2.6 m, the impact on the household economy would be severe.
In the short term, the most significant negative impact will be on daily wage earners. These are the 1.7 m men and women helpers at construction sites, loaders at the Pettah market, rubber tappers, daily domestic helpers and such who are suddenly without any income.
8.0 The impact on expenditure
The expenditure side of the equation will certainly see a reduction. As explained earlier the national food to non-food ratio 35:65. However, in urban areas this is 31:69, rural 35:65 and estate 49:51. Also, food expenditure will vary in terms of income; low income homes will spend on essentials that cannot be reduced or substituted (estate sector spends half their income on food as shown earlier) while high income homes will have the option to reduce and substitute.
The biggest non-food component of rent or mortgage payment will be fixed and so will be the loan or lease repayment to finance companies or banks unless enjoying a moratorium. Other fixed expenses will remain; such as healthcare. Expenses on transport will fall but communication will rise with the higher usage of data. Expenses on durables, as well as on personal care products, clothes and lifestyle and other impulse products and services will reduce. But the share of such expenditure on such items is very small in lower income homes than in higher income homes.
In summary the reduction in expenditure will not be directly correlated to income unless in the case of small entrepreneurs or the self-employed where a corresponding lowering of variable costs will be experienced. An example would be a three-wheel driver whose fuel cost will be saved since he will not have any hires. But at the same time his fixed costs will remain; here the lease and insurance payment etc. unless waived by the finance company. So, for most households the reduction in expenditure will be far less than the reduction in income; this will be particularly true for the low-income homes or the lowest five income deciles.
9.0 The severity of the outcome and size of problem
Figure 1 illustrates in a very general sense both the level and number of households at risk as well as the frequency in which they would have to be provided relief in terms of which quadrant the workers fall in to.
For instance, the risk of loss of net income is lowest among 1.2 m public sector and 0.2 m private sector essential workers and need for Government relief is minimum. But the risk highest among the 1.7 m daily wage earners and immediate and at least weekly relief is required for them to keep abreast.
10.0 Monetary value of the loss to households
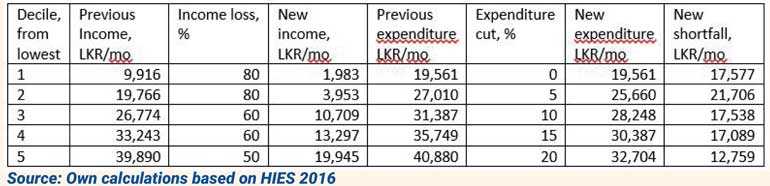
Assuming loss of income of 80% each in the first two deciles, 60% each for the next two deciles and 50% for the fifth decile, which would be a conservative estimate for the lowest income earning household given available data and also taking in to consideration approximately 10% non-monetary income at the national level and reduction in expenditure of 0, 5, 10, 15 and 20% respectively for each decile the following new income and expenditure levels and difference in monthly amounts are generated. Please note that these assumptions can certainly be changed with more updated data.
If approximately 525,000 families are assumed for each household decile the total amount to be given out as income-support to all needy households will be Rs. 45.5 b.
Without accounting for inflation between mid-2017 and mid-2020 of 5% per year, this total amount of roughly LKR 45,500m to be granted as income support for the neediest households in Sri Lanka will be as follows: 1st – Rs. 9.2 b; 2nd – 11.4 b; 3rd – 9.2 b; 4th – 9.0 b; and 5th – 6.7 b. Making a simplifying assumption that the labour force is equally distributed among all households, then, half the families representing the five lowest income deciles would account for half the workers; that is half of eight million or four million. Therefore, the Rs. 45,500 m would be distributed among four million workers; some getting more and some less based on their actual shortfall. If adjusted for inflation the amount would be Rs. 52,325 m. However, the actual amount will vary based on how much of this amount may be granted and for how many months same is provided. The duration of support cannot be estimated with the available data and will depend on how long the lockdown will remain and what the rate of normalisation will be. That will become clear in the coming days.
11.0 A comparison of the proposed income-support package in terms of Government revenue and expenditure
In terms of share of revenue of the Government for 2019, Rs. 45.5b is 2.6% of 2019 tax revenue of Rs. 1,735 m. From an expenditure perspective, Rs. 45.5b works out to 1.6% of the total recurrent and capital expenditure amounting to Rs. 2,932b or 2.0% of the recurrent amount for 2019 which was Rs. 2,301 b. Looked at it in another way, Rs. 45 b is 6.6% of the total salary bill of the public sector in 2019 amounting to Rs. 686 b.
At the current exchange rate this amount is roughly $ 233 m and well within the expected $ 800 m from IMF’s Rapid Credit Facility for COVID-19 budgetary support or the $ 300 m ADB budgetary support loan, both of which are to be at concessional terms. The Government has already obtained $ 500 m loan from China and is expecting another $ 800 m of which terms are not known. The World Bank has already granted a long-term soft loan of 128 m specifically for COVID-19 related expenditure. In addition, G20 nations have called for debt suspension for low income countries and even though Sri Lanka has graduated, but yet in transition, the Government could also utilise part of the expected $ 1,200 m that would be saved in 2020.
12.0 It is the responsibility of the Government to find the best option
The entire amount need not be financed by the Government. While part of this amount, say for daily wage workers and some amount of micro-scale self-employed persons could be direct income-support by the Government. The rest of the self-employed entrepreneurs, can be financed via the commercial banking system as long-term concessionary finance guaranteed to some extent by the Government. In terms of delivery of the income-support package, the direct Government support should be almost immediate and could be handed out in either weekly or by-weekly instalments whereas the other component could be a monthly program.
In conclusion however, it is clear that very many low-income Sri Lankan households are in dire difficulty with the continuing COVID-19 lockdown and they need urgent income-support. It is the responsibility of the Government to arrive at a workable solution given multiple options available.
(The writer is a former Member of Parliament.)'
Table 1: Monthly mean household expenditure and household income by national household income decile, 2016
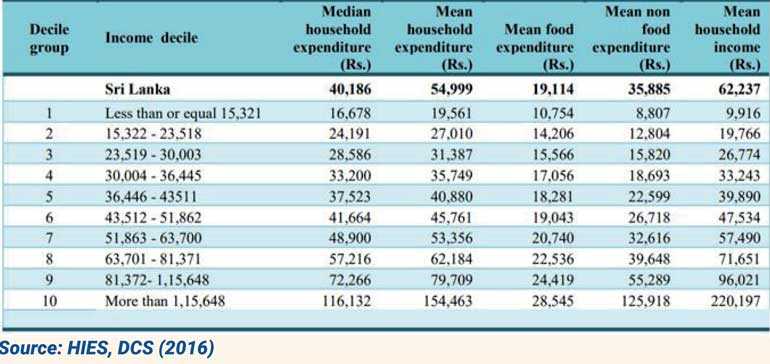
Table 2: Adjusted mean monthly household incomes and expenditure of decile 1 – 5 as per 2016 HIES