Monday Jun 15, 2026
Monday Jun 15, 2026
Monday, 16 November 2015 00:00 - - {{hitsCtrl.values.hits}}
This article will explore a different thinking to risk management by the regulator and for policymakers.
Firstly assume that the Sri Lankan economy is similar to a group of companies (named SLG) in the market place. Any exports of Sri Lanka constitute real sales made by SLG.
Similarly, there is inter- and intra-company trading in this SLG. The commodity traded is money. Also assume that the banking sector is the Treasury function of SLG which controls almost 70% of the assets in the financial system of Sri Lanka or SLG. Through transfer pricing (interest rates) the SLG Treasury can make divisional profits (banking sector) at the expense of the other companies in the group and making other companies (manufacturing, construction, plantations, transport and all other sectors other than the financial sector) that much uncompetitive in the world arena.
This is exactly what has happened to the group of companies called Sri Lanka. The following discussion will be a conceptual framework for the experts and pundits to consider and debate about to derive any sensible outcome.
Financial System
Let us look at how the Financial System has been evolving in the past.
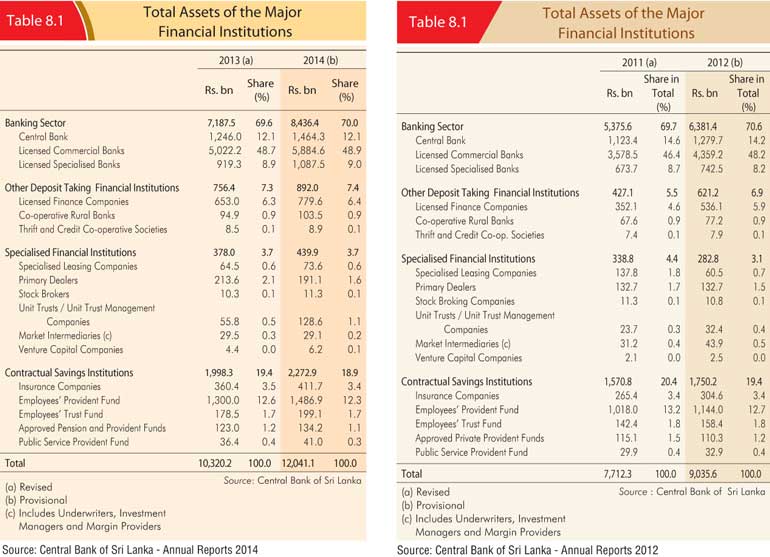
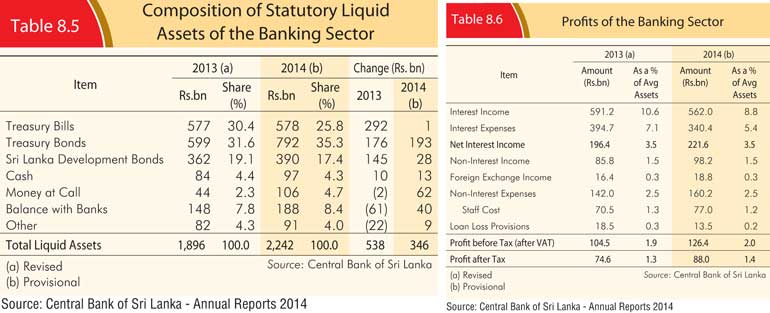
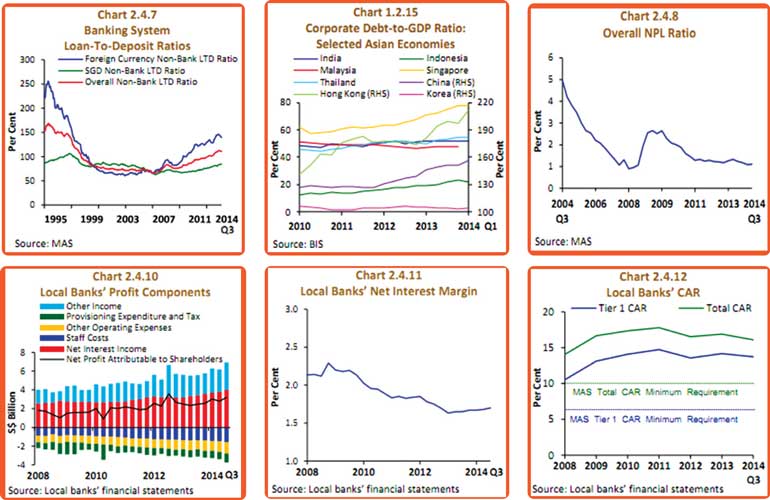
As it is observed about 70% of the Financial System assets are managed by the banking sector with a total shareholder fund of Rs.569 b (Chart 8.3). Financial sector has made a collective profit after tax (F/Y 2014) of Rs. 88 b (Chart 8.6) in order to meet the shareholder expectation of well over 15% of ROE. (PAT/Total Capital Funds = 88/569 = 15.46%) But based on BASEL III requirement the minimum Tier I capital is 6% and Total Capital of 10% (TI & TII). Sri Lanka is still in Basel II criteria.
Banking sector
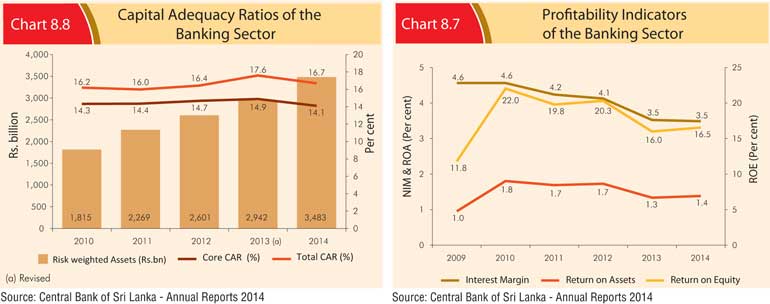
Currently the banking sector is holding on to 14.1% of Tier I (Chart 8.8) when the future requirement under Basel III is just 6%. From Sri Lanka’s context, the statutory requirement is 5% as at now, as opposed to the Basel II requirement of 4%. If one assesses the Tier I required to hold the current assets under management, a crude computation can be made in the following manner (without considering RWA): (569/14.1)*5 = 201.7Bn (LKR)
Therefore, if the banking sector is to satisfy its shareholders by offering 15% ROE, the profit which should have been earned constitutes a mere 30.26 b. But the earnings were at 88 b for 2014 and growing YOY. This is a deprivation of real sector growth potential. This extra 57 b of profit should have been in the hands of the entrepreneurs/corporates. If that was the case following could have been witnessed:
What can the banking sector do about it:
It is customary for the banking sector to generate ROE in the range of 15% to 20% (Chart 8.7) through their pricing mechanism. Therefore whatever reforms are done to the policy rate, the market will never see the benefit passed on to the real economy due to inefficiency in financial intermediation, unless the Central Bank is ordered to bring the NIM down to about the 1.5% range from the current 3.5% as depicted in Chart 8.8 above.
Participants must look more towards efficiency improvements through IT advancements, business process reengineering, BPO (locally), value based fee income mechanism.
This is what JKS E Consultants Ltd. do (www.jkseconsultants.com), providing solutions/concepts by identifying inefficiencies in organisations, industries, business process reengineering, strategise businesses, advising board of directors. Contact us through [email protected] for a non-obligatory discussion with our principal consultant.
Liquidity
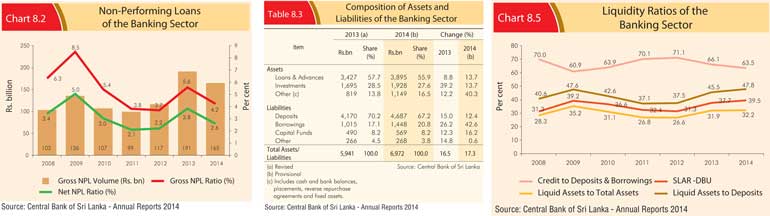
Taking the discussion further, let’s look at how inefficient is Sri Lanka banking sector liquidity management strategies (Chart 8.5). The Sri Lanka Statutory Liquid Asset Ratio (SLAR) is 20%. Generally liquidity is required to meet the urgent outflows of the banking sector for demand, seasonal and in the case of run on a bank.
But with all the regulatory supervision, risk management strategies; with limited product offers (No derivatives) a run on a bank is very remote unless it is man-made similar to the Seylan Bank Plc debacle in the recent past.
Further advance to deposit ratio is as low as 60% to 70% range which brings about less risk to the banking sector. We Sri Lankans have been thought too much of risk and covered from every aspect, rather than understanding the calculated real risk factor and mitigating same with risk management/pricing strategies. Out of 8.4 trillion assets under management of the banking sector, 2.2 trillion is parked in non-productive investments as described in Chart 8.5.
It is proposed that SLAR (Statutory Liquid Asset Ratio) be structured based on the stability and the real business needs of the financial system. Supposing a bank with a financial position of over one trillion (LKR) will have a customer base of well over 5 million customers.
Even a run on this type of bank, it will take many months for majority of the customers to react to the news and highly diversified in risk appetite. In this scenario, the regulator has adequate time to intervene and build the confidence of the customers whilst taking necessary action at the senior management of the bank.
It stabilises the financial system promptly having adequate time for corrective action. This is the same principle that USA Federal Reserve Bank followed (2008 Global Financial Crisis) for larger banks by infusing capital and owning shares temporarily. (Too big to fail concept to avoid domino effect) Therefore following the structured approach to meeting SLAR is proposed;
It is essential to bring about the above changes to improve the earning potential of banks rather than blocking funds with government securities and similar products with a fraction of margin. This inefficiency is compensated through charging a higher rate of interest from the regular customers/enterprises which are the main players of the economy.
Financial intermediation
It is proven by the above analysis how inefficient our Sri Lankan financial intermediation is and who has been pocketing the cost of same. Therefore the metaphor of comparing the Sri Lankan economy to a group of companies and linking the banking sector to the Treasury department in it is very relevant. Internal transfer pricing is inefficient (asset pricing) and this has resulted in a higher cost of production, which has resulted in depriving the country of earning more foreign income by way of higher exports (Capital as well as goods).
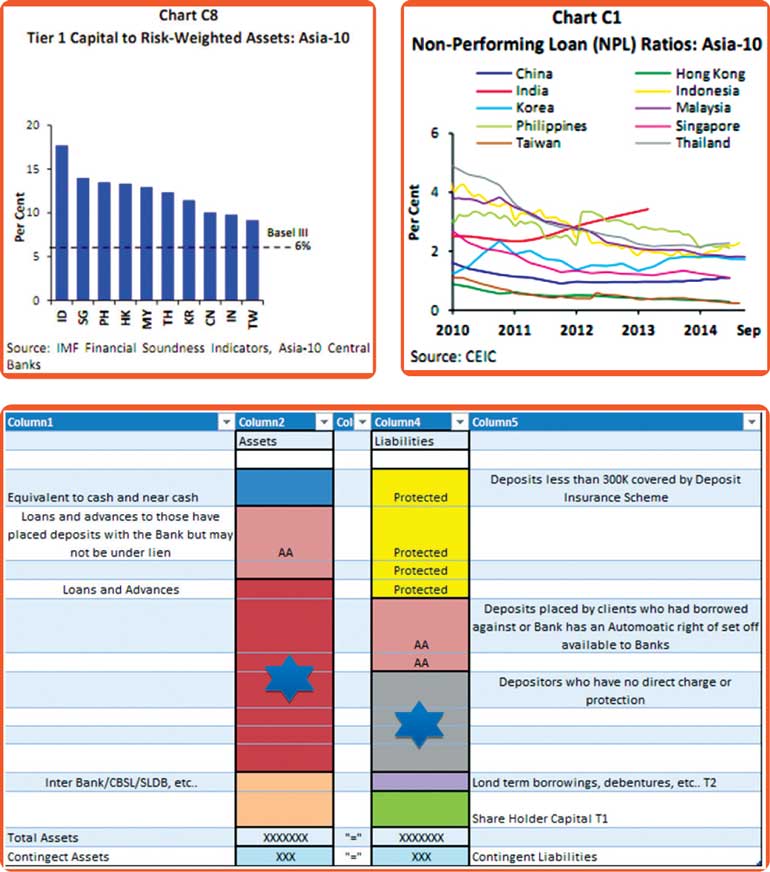
Let us dissect a typical financial position statement of a bank:
Asset book comprises:
Liability book comprises:
Long-term borrowings from foreign agencies, debt instruments, etc.
From a risk perspective, what segments of assets and liabilities are at risk? Loans and Overdrafts segment with a star has the risk concerns of credit risk, market risk, liquidity risk, etc. but banks have come so far and their credit evaluation processes are fine-tuned and well equipped to manage above risk elements except for identifying potential clients/projects based purely on a feasibility/cash flow basis, especially with regard to Information Technology based startup companies. Sri Lanka would have missed a syndicate loan opportunity in the recent Virtusa acquisition of Polaris, for $ 300 m.
Vulnerable depositors are shown by a star in the above financial position snapshot on the liability side. What element of capital should be tied up to secure this risk element on the asset side after considering what was discussed above?
SLAR-based assets and debt borrowings are done with in-depth analysis of the counter party risks by the depositor as well as the lender.
Sri Lanka NPL status is given below in Chart 8.2 which cannot be compared with regional players
Singapore and selected Asian countries’ facts (based on Monetary Authority of Singapore Financial Stability Review of November 2014)
Storm, form and norm
In conclusion, Sri Lanka must storm the financial system and find the right blend to eliminate the inefficiencies and complacencies of the management style. Once the NIM is squeezed to the 1.5% range and SLAR is based on asset book size, automatically the scattered financial system (players) will consolidate at their own discretion rather than through compulsion. Form the market through a turbulent time and norm it with the right blend once it is found.
(The writer is a Business Consultant. Your views are welcome. Email – [email protected]. These are his personal views and based on publicly available data.)