Thursday Sep 10, 2026
Thursday Sep 10, 2026
Thursday, 10 September 2026 04:35 - - {{hitsCtrl.values.hits}}
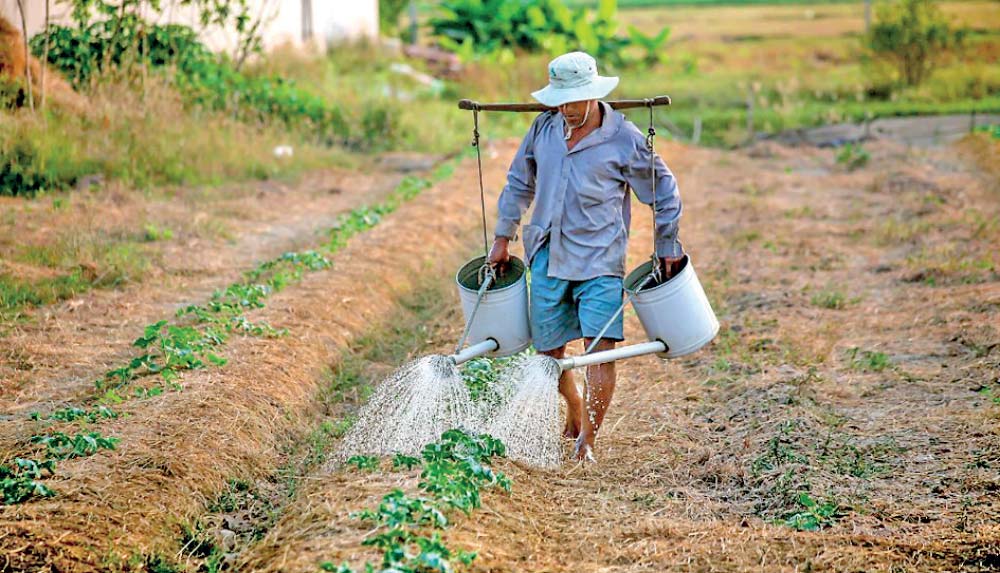
Half of the farmers responding to the largest international farmer survey conducted to date say they are not paid fairly for what they produce, and nearly one in four say their income has fallen sharply over the past year, according to the Voice of the Farmer 2026 survey.
The survey, run by the agricultural knowledge platform Wikifarmer, gathered responses from 10,234 farmers in 158 countries between November 2025 and March 2026. It asked farmers, in their own words, about the prices they receive, their incomes, the climate damage they have absorbed, the support they get from their governments, and how their work affects them.
The picture that emerges is one of a profession under sustained financial and environmental strain—and one that feels largely unsupported by the institutions meant to back it.
A widespread sense of being underpaid
Among the farmers who answered the pricing question, 51.1% said they do not receive fair prices for their produce. Income was heading the same direction: 45.1% reported that their net income this year was worse than the year before, with 24.1% describing it as “much worse.” Only 9.4% said their income was much better—meaning the “much worse” group outnumbered the “much better” group by more than two and a half to one.
The decline was steepest in Europe, where 55.7% of farmers reported lower incomes— more than double the rate in Oceania (27.1%). South Asia (44.1%) and Africa (43.4%) followed.
Almost half of all respondents (47.5%) rated their own financial security at the bottom of a five-point scale.
Climate damage is now the norm
Climate and pest losses were nearly universal. Of those who answered, 83% reported losing part of this year’s production to weather or pests, and one in four (25.2%) said they had lost more than a quarter of their output. Among the higher-response countries, the steepest rates of severe loss were reported in Greece, Italy, Afghanistan, India, and Colombia. Each additional climate hazard a farmer reported was associated with higher odds of reporting an income decline.
Drought was the most damaging hazard: among farmers exposed to it, 37.4% reported severe losses. Heat, flooding, storms, and frost followed.
Governments rated at the floor — across very different countries
Farmers were sharply critical of the support they receive from the State. On a five-point scale, 63.4% rated their government’s support a 1 or 2, and nearly half (47.7%) gave it the lowest possible score. Only 13% rated it positively.
Strikingly, the discontent crossed political and economic lines. The five lowest-rated countries—clustered between 1.66 and 1.73 out of 5—were Cameroon, the Democratic Republic of Congo, Greece, Poland, and Peru: a grouping of very different nations whose farmers reported strikingly similar experiences.
The survey also found that government-support ratings tracked closely with farmers’ economic reality rather than general grievance. Farmers who rated support at the floor were about 34 percentage points more likely to report poor financial security and unfair prices than those who rated it highly.
A mental health toll that peaks mid-career
The strain extended to wellbeing. More than one farmer in five (21.4%) chose the highest possible score on the stress scale, and over a third (34.9%) rated themselves at the top two levels. The average stress score was 3.17 out of 5.
Stress was not constant across a farming life. It built through early adulthood, peaked among farmers aged 41 to 50 (41.8% reporting high stress), and eased somewhat after 60.
Online selling stands out
A bright spot emerged in the analysis. After controlling simultaneously for region, farm size, age, certification, and climate exposure, farmers who sold directly to customers online were 35% less likely to report an income decline—the strongest protective factor of any variable in the model. Selling at farmers’ markets was also associated with lower odds of decline (20% less likely), though the online effect was the largest.
Challenging common misconceptions
Regional patterns challenged conventional assumptions about agricultural vulnerability. Respondents in Africa and South Asia reported markedly higher rates of perceived fair pricing than respondents in Europe and Latin America—the strongest geographic effect measured in the survey.
One of the survey’s strongest statistical signals concerns farm size. Contrary to expectations that larger farms are more financially resilient, respondents operating farms of 50 hectares or more reported substantially higher average stress levels than those managing farms of less than one hectare—the single largest group difference in the dataset.
Survey Lead Researcher and Wikifarmer Library Content Editor agronomist Georgios Myrisis said: “This survey suggests the pressures reshaping agriculture are broader and more complex than many assume. Across regions and farm sizes, large numbers of farmers told us they do not feel fairly paid for what they produce. That should be the starting point for serious conversations about the future of food systems. Several widely held assumptions about vulnerability also did not hold in our data: larger farms in the sample often reported higher stress than smaller holdings, showing that pressure across agriculture is changing in ways the sector needs to understand better.”
Who answered
The respondents were predominantly full-time smallholders: 81.9% farmed full-time, and 54.5% worked five hectares or less. Africa was the largest single region (38%), followed by Europe (22.1%), Latin America (18.7%), and South Asia (15.9%). Pakistan, France, Algeria, Uganda, and Mexico contributed the most responses.
The survey was conducted through Wikifarmer’s farmer network, partner organisations, and paid digital advertising via Meta, Google, and LinkedIn. The sample is self-selected and reflects farmers reachable through these channels; it is not a probability sample of the global farming population. Findings are reported as the views of participating farmers and are not extrapolated to national or global populations.
All percentages use per-question denominators and 95% Wilson confidence intervals. Country-level results with confidence intervals are available for the 29 countries with the highest response rates.
The full dataset, methodology note, and chart pack are available to accredited media under embargo via the media contact. Researchers are also available for interview and follow-up analysis.