Saturday Jul 04, 2026
Saturday Jul 04, 2026
Wednesday, 11 May 2016 00:00 - - {{hitsCtrl.values.hits}}
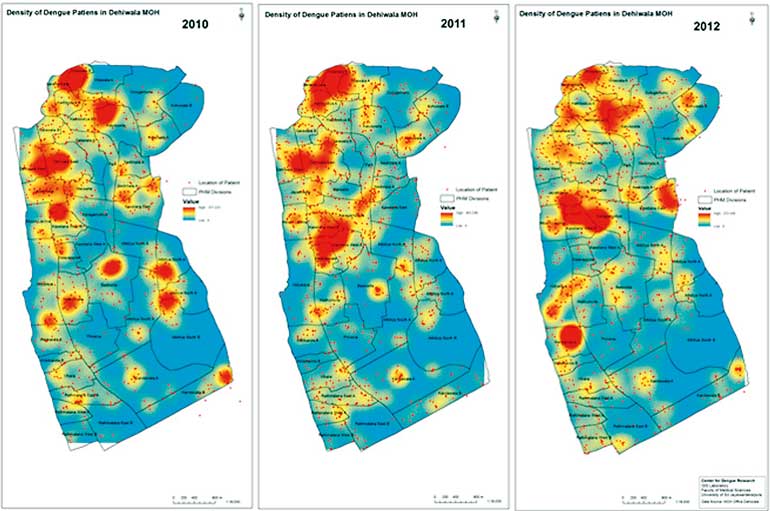 This map from the internet shows the spread of dengue in the Dehiwala area from 2010-2012
By Ashani Jayasinghe-Dabare
Public health efforts have been based on analysis and use of location related data (spatial data) for many years. The first of such cases would be in the 1800s, by Dr. John Snow (Physician – not the character from the much-talked-about TV series ‘Game of Thrones’ these days), who is often credited as the father of epidemiology and is arguably the most famous of those examples.
A hand-drawn paper map was used by Dr. Snow to mark the locations of the reported victims and analyse the geographic locations of deaths related to cholera in London in the mid-1850s. He superimposed his maps showing death locations with maps of public water supplies and was able to find an area where the deaths clustered near a water pump on the city’s Broad Street this pinpointed the Broad Street pump as the most likely source of the cholera outbreak. Removal of the pump’s handle led to a rapid decline in the incidence of cholera, helping the medical community to eventually conclude that cholera was a water-borne disease.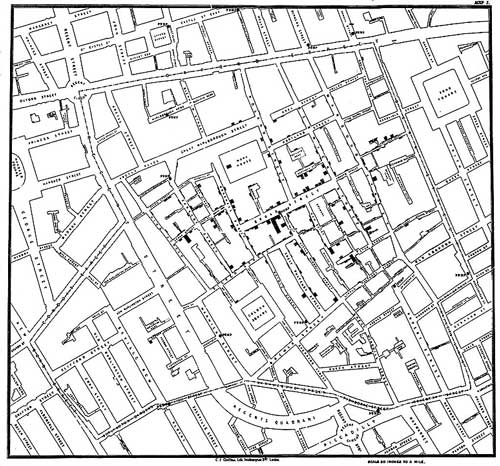
Dr. Snow’s research eventually became part of a field known as disease diffusion mapping (Wikipedia.org). This is an area of study that claims that a disease started from a central source and spread according to patterns and conditions of the environment. Even today, Dr. Snow’s work provides an indication of how a GIS could benefit the public health investigations and other research in this area.
Dr. Snow continued to analyse his data, eventually showing that the incidence rate of cholera was also related to local elevation as well as soil type and alkalinity. Low-lying areas, predominantly those with poorly draining soil, were found to have higher incidence rates for cholera - which Dr. Snow attributed to the pools of water that tended to collect there, again showing evidence that cholera was in fact a water-borne disease (rather than one borne by ‘miasma’ or bad air, as it was commonly believed at the time.)
This is an early example of what has come to be known as disease diffusion mapping, an area of study based on the idea that a disease starts from some source or central point and then spreads throughout the local area according to patterns and conditions there. This is yet another area of research where the capabilities of a GIS have been shown to be of help to practitioners.
GIS for public health
Today’s public health problems are much larger in scope than those Dr. Snow faced in the mid-1850s and researchers today depend on modern GIS or GIS data (that is geographically referenced) and other computer mapping applications to assist in their analyses.
Public Health Informatics (PHI) is an emerging specialty which focuses on the application of information science and technology to public health practice and research. As part of that work, GIS – or more commonly a Spatial Decision Support System (SDSS) which offers improved data and geographic visualisation techniques, leading to faster, better, and more robust understanding and decision-making capabilities in the public health arena.
For example, GIS displays have been used to show a clear relationship between clusters of emergent Chronic Kidney disease patients in Sri Lanka in one case the correlation between the fluoride content ground water and dental health issues in certain parts of the country or how concentration of Thalassemia patients is high in the Kurunegala district versus the rest of the country.
Dengue was another disease that was mapped for decision support heavily in Sri Lanka. The map from the internet shows the spread of dengue in the Dehiwala area from 2010-2012.
Maps like this help decision makers in modelling the disease spread trends location wise and manage the same. E.g. Without spraying mosquito killer sprays all over, the focus should be on the victim concentrated areas for eradication of the disease and effective use of resources. So viewing of health data can be very beneficial to health officials and public health decision makers.
In more developed countries like Singapore, they use these health GIS maps for control of diseases like diabetics and infant health care. Real-time GIS technology is used to update regional and national health departments cases reported at regional clinics, then the data is automatically mapped in to the country map and used as a decision support tool. Map and location based Information from other sources are also overlapped on top of this existing data to analyse trends time related patterns, etc., and take decisions that improve the population health
A few more international examples that can be sited include from the US, the recording of Hepatitis C cases and those of known intravenous drug users in Connecticut. Causality is difficult to prove conclusively – collocation does not establish causation – but confirmation of previously established causal relationships (like intravenous drug use and Hepatitis C) can strengthen acceptance of those relationships, as well as help to demonstrate the utility and reliability of GIS-related solution techniques. Conversely, showing the coincidence of potential causal factors with the ultimate effect can help suggest a potential causal relationship, thereby driving further investigation and analysis (source needed?).
Alternately, GIS techniques have been used to show a lack of correlation between causes and effects or between different effects. For example, the distributions of both birth defects and infant mortality in Iowa were studied, and the researchers found no relationship in those data. This led to the conclusion that birth defects and infant mortality are likely unrelated, and are likely due to different causes and risk factors.
GIS can support public health in different ways as well. First and foremost, GIS displays can help inform proper understanding and drive better decisions. GIS can play a significant role in the effort to improve and sustain the health of the citizens, that effort, helping public health practitioners identify areas of disparities or inequities, and ideally helping them identify and develop solutions to address those shortcomings. GIS can also help researchers integrate disparate data from a wide variety of sources (e.g. map data on demographics by the Census and Statistics Department, disaster prone area maps from the disaster management centre, etc.) and discover trends and correlational factors that effect a population.
Issues with GIS for public health
Unfortunately, much public health data is still manually generated, and is therefore subject to human-generated mistakes and miscoding and misinterpretation.
There are also concerns or issues with use of GIS tools for public health efforts. Chief among those is a concern for privacy and confidentiality of individuals.
Public health is concerned about the health of the population as a whole, but must use data on the health of individuals to make many of those assessments, and protecting the privacy and confidentiality of those individuals is of paramount importance. Use of GIS displays and related databases raises the potential of compromising those privacy standards, so some precautions are necessary to avoid pinpointing individuals based on spatial data.
It is well established in the literature that statistical inference based on aggregated data can lead researchers to erroneous conclusions, suggesting relationships that in fact do not exist or obscuring relationships that do in fact exist. This issue is known as the modifiable areal unit problem. For example, In New York public health officials worried that cancer clusters and causes would be misidentified after they were forced to post maps showing cancer cases by ZIP code on the internet. Their assertion was that ZIP codes were designed for a purpose unrelated to public health issues, and so use of these arbitrary boundaries might lead to inappropriate groupings and then to incorrect conclusions.
Conclusion
The field of Medical Geographic Information Systems (Medical GIS) has become extremely useful in understanding the bigger picture of public health. The discipline holds a substantial capacity to understand not only differences, but also similarities in population health all over the world. The main goal of marrying the disciplines of medical geography, public health and informatics is to understand how countless health issues impact populations, and the trends by which these populations are affected.
From the 1990s to today, this practical approach has become a valued and progressive system in analysing medical and epidemiological phenomena ranging from cholera to cancer. The instruments supporting this field include geographic information systems (GIS), disease surveillance, big data, and analytical approaches like the Geographical Analysis Machine (GAM), Dynamic Continuous Area Space Time Analysis (DYCAST), cellular automata, agent-based modelling, spatial statistics and self-organising maps.
The positive effects on disease mapping have proven to be tremendous as these instruments continue to have a great impact on the mission to improve worldwide health care. While traditional uses of GIS in public health are static and lacking real-time components, implementing a space-time animation in these instruments will be monumental as technology and data continue to grow.
The use of GIS in public health is still in its infancy stage of application and like most new applications – there is a lot of potential to be harnessed and drawbacks to be evaded on this path. Many researchers and practitioners are concentrating on this effort, hoping that the benefits will outweigh, the risks and the costs linked with this evolving application area for furthering the modern GIS techniques.
Footnotes
(The writer is CEO of GIS Solutions and Subsidiary of Just In Time Group.)


