Thursday Feb 19, 2026
Thursday Feb 19, 2026
Monday, 30 October 2017 00:01 - - {{hitsCtrl.values.hits}}
The final report of the 2016 Household Income and Expenditure Survey is out. For researchers like us who have been stuck with 2012-13 data, this is like rain in the Dry Zone. But what we’ve been given is a drizzle, in the form of a short summary, rather than the full document that will satisfy our parched brains.

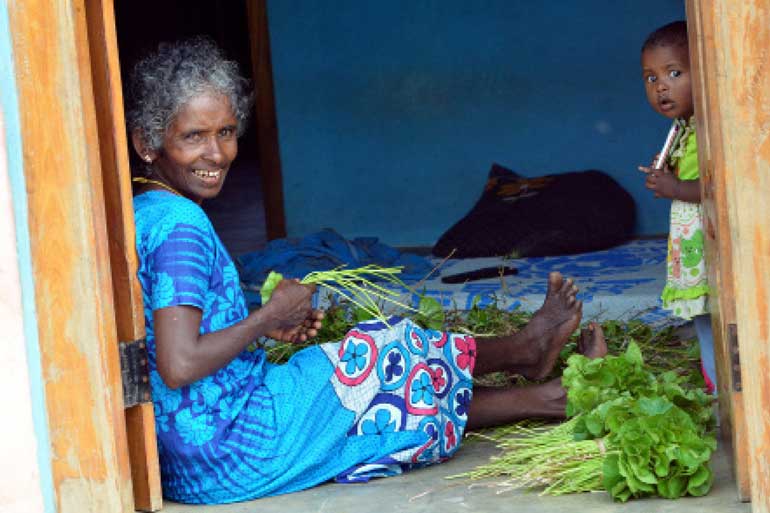
There is cause for concern: Households in Batticaloa, Kilinochchi and Mullaitivu are spending more than half their expenditures on food. The Government is well advised to focus its anti-poverty efforts in these districts, which happen to be mostly populated by Tamil people – Pic by Shehan Gunasekara
But what does the summary say? It shows that poverty has declined overall. It also says that much more attention needs to be paid to poverty alleviation in the post-conflict areas in the north and the east.
These conclusions are based on a robust indicator, the food ratio, which in turn is based on Engel’s Law. In a famous study using the budget data of 153 Belgian families, Engel found that the lower a family’s income, the greater is the proportion of it spent on food. Later studies have confirmed this empirical regularity, which has been called Engel’s Law. According to H. S. Houthakker (1957), “of all the empirical regularities observed in economic data, Engel’s Law is probably the best established.”

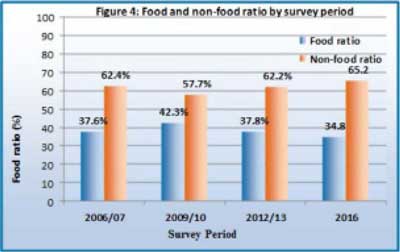
The less a household spends on food, as against other things, the more prosperous it is. In the early 1980-81, an average Sri Lankan household spent 65% of its total expenditures on food. In 2016, the ratio has been reversed. Now it is 34.8%.
This number should have declined continuously along with the increase in our per-capita GDP. But, as Figure 4 from the Final Report shows, the 2005-15 years were anomalous. It is only in 2016 that the percentage spent on food by an average household became smaller than the percentage in 2006-07.
I have been pointing out the problem, especially the significant increase shown by the 2009-10 HIES, but have not been able to come up with a good explanation. Anyway, we can be happy that things have improved since 2010 and that we are back on track in 2016.
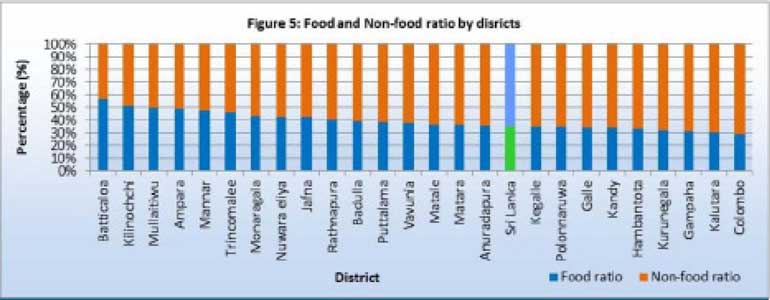
But there is cause for concern. Households in Batticaloa, Kilinochchi and Mullaitivu are spending more than half their expenditures on food as shown in Figure 5 from the 2016 HIES Final Report. They have less money to spend on transportation, health and beauty care, education, pilgrimages, etc.
The absolute amounts in leading districts such as Colombo and Gampaha are double the mean household  expenditures in the laggard districts. Households in the laggard districts have less money; of that they have to spend half on food, a non-discretionary category. The effects of the conflict and distance from Colombo appear to be the obvious causes.
The Government is well advised to focus its anti-poverty efforts in these districts, which happen to be mostly populated by Tamil people.
Next worse-off are households in the Ampara, Mannar and Trincomalee districts, again post-conflict areas with significant minority-ethnicity populations, though not only Tamils.
Many of the districts with high food ratios are agriculture-based. For example, Ampara is a major rice producer. Of the Jaffna labour force, 40% are engaged in agriculture. It would seem that giving priority to the government’s plans to improve the efficacy of agricultural supply chains is likely to yield good outcomes in terms of poverty alleviation.
The fact that households in Hambantota, which used to be the one of the poorest districts in the country, have food ratios better than the Sri Lanka average suggests that the massive infrastructure spending in that district in 2005-15 may finally be showing some beneficial impacts on households that could not be seen when I looked at the numbers in 2011.
The evidence is not conclusive, but it is possible that the cause is improved access to markets, made possible by infrastructure investments.
