Saturday Jun 13, 2026
Saturday Jun 13, 2026
Tuesday, 5 September 2017 00:24 - - {{hitsCtrl.values.hits}}
‘State of the Climate – 2016’ (SOC-16) is a 298-page document published by the American Meteorological Society. It is based on contributions from about 500 scientists from 60 countries – unfortunately none from Sri Lanka – and thousands of data sets.
It was released online on 8 August 2017 giving valuable information on how 40 climate variables have changed during 2016. I have been studying this since 2010 and waiting for the 2016 report to check the validity of some of the arguments I have been advocating since of late.
CO2 vs. NFW hypotheses
Current day climate change theories are based on the following hypotheses.
1.Although water vapour is the most influential greenhouse gas in atmosphere, any new water vapour entering the atmosphere will not increase the greenhouse effect of the atmosphere as it would condense in a few weeks.
2.CO2 and other greenhouse gases (primary stimulants) entering the atmosphere anew spend more time in the atmosphere and increase the greenhouse effect of the atmosphere and water vapour (secondary stimulant) entering the atmosphere to maintain constant relative humidity at the elevated temperature (first temperature increase due to primary stimulants) will stay there and exert an additional greenhouse effect and further increase temperature (second temperature increase due to secondary stimulant).
But these theories are silent about the Newly Formed Water (NFW) vapour arising from the combustion of oil and gas containing about two and four atoms respectively of hydrogen for each atom of carbon (Table 8.1 in Sustainable Energy by Prof. Jefferson Tester, et al).
I call this Newly Formed Water because this was not available as water in the global water cycle earlier. Even the IGSM 2 Model put out by the MIT Joint Programme on Science and Policy of Global Change has not included NFW in its stream from Human System to Earth System. One important aspect of this NFW is that it enters the atmosphere along with CO2 from the same oil and gas combustion and hence will remain behind in the atmosphere.
If you look at, as per climate scientists, doubling CO2 concentration from 280 ppm to 560 ppm, the primary stimulant increases temperature by 1.20C and the secondary stimulant by another 1.60C, totalling up to the well-known 2.80C increase. My contention with NFW is that NFW acts as a primary stimulant, bringing in a secondary stimulant stream resulting in two sets of temperature increases only.
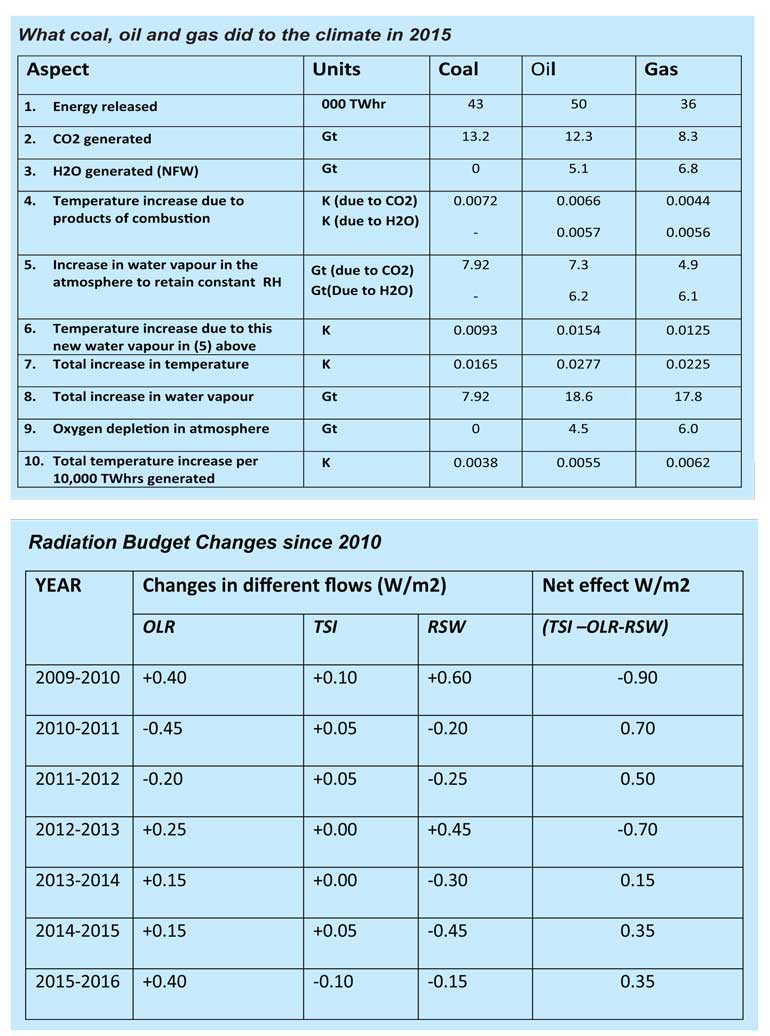
In 2015, we have generated 43,000 TW hrs from coal, 50,000 TWhrs from oil and 36,000 TWhrs from gas and corresponding outcomes from these along the above line of thought are given below. This is about a 4% drop from 2011 for coal, an 11% increase for oil and a 33% increase for gas resulting in an 8.0% increase in CO2, 21% increase in NFW to meet the 9.6% increase in total energy from fossil fuels. A 21% increase in NFW to achieve a 1.6% decrease in CO2.
State of the Climate – 2016 explained on this basis
We intend to explain some of the 33 parameters mentioned in page S2 using this NFW hypothesis. This will help readers to assess NFW’s contribution towards climate change vis-à-vis CO2 from the same fossil fuels, etc.
i. Surface temperature
If we look at a possible value for temperature increase based on the previously mentioned 2.80 C due to a 280 ppm increase and 3.5 ppm CO2 increase in 2011, we will arrive at a figure of 0.0350 C. We agree that (a) direct comparisons cannot be made based on ppm levels of CO2 and (b) as the CO2 level increases the temperature increase for a given CO2 increase reduces; but the current CO2 ppm level is about halfway between 280 and 560 and if at all it differs from 0.0350C, it could only be much less. But SOC 16 says that the temperature increase is around 0.01-0.120 C above the previous maximum observed in 2015.This is in spite of the 11-year solar cycle crossing the maximum (Note Total Solar Irradiance dropped by 0.10Wm-2 in 2016).
This implies that the global temperature will indicate a downward trend in the next five-six years as has been the case with the second half of the earlier 11-year solar cycles, if oil and gas consumptions do not increase significantly.
The NFW approach yields a temperature increase of 0.0680 C due to products of combustion from fossil fuels and when other effects from deforestation, highway construction, etc. are taken into consideration it may be much more. Once these are adjusted for their reduced sensitivities to increases in greenhouse gas concentrations, we will arrive at a temperature closer to the observed values.
ii. Extreme warm days
This graph depicts that in 2016 we have experienced about 18% extremely warm days above the 1961-1990 level and these drought conditions were of unusually long durations. Both these extreme phenomena can be more easily explained using NFW rather than with only CO2.
The NFW approach implies there is more water vapour in the atmosphere rather than using only the CO2 approach, and normal seasonal changes may not be able to bring the temperature down adequately due to this water vapour to condense all the water vapour and bring drought to a close. Anyhow, with temperatures coming down more with the solar cycle effect, droughts in the next few years will be comparatively shorter; unless of course a lot more oil and gas is used to replace coal.
iii. Precipitation
Precipitation increased by about 20 mm (or was it 40 mm) during 2016 in a setup which also experienced a temperature increase of 0.01-0.120C.
When somebody consumes 1 litre (0.8 kg) of gasoline in a vehicle, he or she also generates 1.03 kg or 1 litre of NFW (secondary school level Chemistry) in addition to which another three litres of water is brought into the atmosphere to maintain constant relative humidity. This implies that at least 25% of precipitation from oil and gas is due to NFW and this would be true even if this NFW condenses only after a short residence time of a few weeks as suggested by current beliefs. And this also should mean that there will be continuous rain and the mere fact that this is not how we experience precipitation implies that there is spatial and temporal accumulation of NFW in the atmosphere. With the 11-year solar cycle entering its downward half of the cycle, we should expect more precipitation in the coming few years which should offer reminders of the precipitation and floods in 2010-11.
iv. Humidity
The relative humidity of the land area has remained within ± 1.5% level while that above the oceans has remained within an even lesser range. So the assumption about constant relative humidity has been valid. Humidity has increased by around 1% during the year (total column water vapour has increased by about 0.25 mm from the average value of 25 mm). If we assume that additional water vapour has come into atmosphere only to maintain constant relative humidity corresponding to 0.0350 C resulting from CO2-based temperature increase computations, the increase in humidity should have been only 0.245%.
v. Land wind speed and tropical cyclones
This again has been increasing during 2016 and even here NFW will influence the increase more than CO2. If you look at viscosities of O2 (the gas NFW replaces in atmosphere on a 8:9 basis), N2, CO2 and NFW they are in the ratio of 25:22:19:13. The SOC – 16 also says there had been 93 named tropical cyclones in 2016 and if you look at the six reasons which would prompt the formation of a cyclone, five of them are instigated by NFW and the sixth is a latitude-related reason.
vi. Radiation budget at the top of the atmosphere
The SOC Reports also shows how the radiation budget at the top of atmosphere has changed in that year. I have been following this since 2010 and the corresponding changes since then are given in the table.
When Kiehl and Trentberth published their original Mean Energy Budget Diagram (shown below) they made the three statements given below. These are important in understanding the diagram and interpreting the SOC – 16 section on this Radiation Budget.
a. 78 Wm-2 stream due to evapo-transpiration has been calculated as the latent heat due to 1000 mm of annual rainfall.
b. 24Wm-2 Thermals flow from the earth is calculated by carrying out an energy balance.
c. In some years the oceans might absorb a certain amount of heat to balance the system.
These changes show that TSI has recorded a negative change for the first time (during the last seven years) in 2016.
If one looks at normal solar cycles in the past, they generally involve a TSI increase of about 0.5Wm-2 in about five-six years; since the cycle has displayed a minimum in 2006, there seems to be an abnormality in this process. Reduction of 0.10Wm-2 in 2016 may be indication that the solar cycle has passed the maximum point. It may also indicate that we should expect increased precipitation in the next few years.
In the SOC – 2015 document it was mentioned that the interannual variabilities are ±50, ±0.20 and ±0.40 Wm-2 respectively for OLR, TSI and RSW. If we use these figures for the changes in these three flow rates, the only flow rate which has shown a variation outside these limits is RSW which has shown two positive changes and one negative change. The increase in RSW in 2012-2013 could be due to the increase in surface albedo during the period and the increase in 2009-2010 had been in spite of a decrease in surface albedo.
This could be due to an increase in cloud formation related to enhanced precipitation experienced in Thailand, Australia, etc. The only product of combustion of fossil fuels which could influence RSW both positively and negatively is NFW which could increase RSW due to cloud formation and reduce RSW due to a phenomenon like atmospheric rivers.
Coming to the OLR, the parameter has not shown a significant variation according to SOC- 2015. SOC – 16 says that the increase in OLR is due to the El Nino effect. This increase could also be due to increased precipitation of 20 mm and if we use the same logic as in the original Kiehl and Trentberth Diagram, increased precipitation could result in an increase of 1.5Wm-2 in OLR.
An overall comment
We have looked at some parameters indicated in SOC-16 and have found that variations in a larger number of parameters could be explained using NFW formed by the combustion of fossil fuels like oil and gas.
This ever-increasing consumption of oil and gas will lead to a future where we will be unable to control the ever increasing precipitation, leading to many a flood associated with landslides, etc. We in Sri Lanka lost more than 300 lives during the floods in the early part of this year and India and Nepal are experiencing greater floods which have killed more than 500 are affecting millions at the moment. We mentioned the US’s experiences in 2016 earlier. The 2 September 2013 issue of Fortune magazine carried 17 photographs of flood-affected scenes from different countries showing clearly that precipitation-related disasters will not spare any country due to its level of sophistication nor its awareness of climate change aspects.
The solution
The most appropriate solution for these disasters will obviously be one which will reduce usage of fossil fuels oil and gas and at the same time favourably influence changes in the above mentioned energy flows crossing Top of Atmosphere. For the luck of mankind, there is one solution which fulfils these requirements.
We call this solution highway solarisation which means, “A dedicated infrastructure for generating electricity for supply to the main grid and/or powering battery electric vehicles using solar energy collected by PV solar panels installed along and above the highways as a solution for climate change.” It will definitely reduce CO2, NFW and waste heat from gas and oil combustion.
Then there is the case of RSW and land surface albedo. One phenomenon which reduces RSW and land surface albedo is the construction of highways which basically involves reduction in vegetation followed by laying a tarred surface on top of that. Highway solarisation will reduce this and for every kWhr of energy generated and provided to the main grid or a battery electric vehicle, it will also eliminate 1.4 kWhrs of absorbed solar energy leading to global warming.
If our explanation of OLR increase is right, use of Highway Solarisation to generate energy eliminating the use of oil or gas will reduce generation of NFW and hence the latent heat. This will influence the OLR favourably. Right now TSI is in a downward trend and if we establish enough projects based on Highway Solarisation during the next five-six years, we can establish more and more projects when the upward trend in TSI sets in, and reduce the impact of increasing TSI on our energy budget.
Conclusion
We have interpreted the findings in the latest State of the Climate – 2016 document using a new approach which considers Newly Formed Water (NFW) due to hydrogen present in oil and gas and found out that these explanations provide more plausible interpretations.
We have also explained changes in energy flow rates crossing Top of Atmosphere. We have also outlined a solution to generate energy without generating both CO2 and NFW and explained how this solution will reduce the impact of changes in these energy flow rates on the Global Energy System.
We are happy that President Donald Trump brought the Paris Accord – enhancing usage of gas to reduce CO2 emissions from coal - into the limelight, giving us an opportunity to re-examine it. As one can see from the figures given above, that would have resulted in bringing more NFW into the atmosphere and this NFW would have (i) increased temperature further when in the air, (ii) created enormous havoc in the form of cyclones, hurricanes while coming down and (iii)created flooding, landslides, etc. when on the ground.
Anybody implementing the Paris Accord; yes, we are also building Noah’s Ark.
(The writer is the Managing Director of Somaratna Consultants Ltd.)


