Tuesday Feb 17, 2026
Tuesday Feb 17, 2026
Monday, 6 April 2020 00:00 - - {{hitsCtrl.values.hits}}

President Gotabaya Rajapaksa
Our dialogues and consideration of what do with and about COVID-19 would benefit greatly by admitting a few things.
*As of this writing we do not know any of the following with any degree of medical, data-underwritten certainty (as opposed to speculative modelling where there are competing, duelling models).
1.The actual death rate from COVID-19
2.The infection rate,
3.The likely fatality rate going forward
4.Or all those who currently have the disease!
We are however sure of catastrophic economic consequences spiralling out of control, and as the above is so unclear we have no choice but to tread ‘carefully’ but with ongoing calibration and readiness to course correct based on evidence.
We should also, in the interests of sane discourse, avoid once and for all the false, fatuous ‘lives versus economy’ refrain that is pulled out any time one points out that we cannot survive on economic ‘magical thinking’ and need a clear strategy.
The ‘economy’ IS lives, and livelihood, viscerally and literally, as much as sheer biologic survival is. It is hopes and dreams of entrepreneurs, wage earners, free-lancers, families, children’s education and future, and more. It is a sense of purpose, and dignity and meaning. And so, we cannot relieve ourselves of the need to balance public health with life being viable.
First, perspective please
At the height of the crisis in Italy, COVID-19 was still only the eighth leading cause of death (by the way, Italy as a whole was not overwhelmed with COVID-19 to anything like the same extent as Lombardy and using ‘Italy’ as a whole as a shorthand is misleading – as of 2 April 2020 Lombardy accounted for 40% of the total number of cases in Italy). This is not to minimise the anguish, the grieving and the tragic sadness that must be the response to every such death statistic. It is however a plea for ‘perspective’.
The non-curfew, but still highly stringent ‘lockdown’ seems, in both ‘Italy’ and Spain to, post 8 March, show an increasing reduction in the daily percentage increase of cases, and as per the Italian health authorities, a reduction in those needing hospitalisation and intensive care even though those numbers seem and frankly are still ominously high on their own. If so, that would be eminently good news, showing the ROI from a targeted lockdown.
Let us also keep in mind that we would expect, regardless, approximately 60 million deaths annually in 2020 (roughly 18 million from heart disease, 10 million from cancer, 6.5 million from respiratory diseases, 1.6 million from diarrhoea, 1.5 million in road accidents, one million from HIV/AIDS, and suicides could hit 800,000) as per the Brookings Institute.
The COVID-19 numbers to date if taken as unproblematic (they’re not, see below) as of 2 April would still just constitute 1.3% of that for the first quarter. That could change at any time, but until it does, we must agree to bow to data as best we have it.
As of 3 April, COVID-19 is nowhere on the top 20 death causes to date in 2020. As against 53,198 COVID-19-related or I should say COVID-19-ascribed (see below) deaths, number 20 on the ‘top 20’ list of killers is birth asphyxia and birth trauma, shown responsible for 189,901 deaths to date in 2020.
And now the R0 goal
As a new disease appears, we are told world health bodies try to gauge whether it will spread and so look to what is being called ‘the basic reproduction number’. This is R0 or R-naught. A helpful parameter for experts, a nightmare for public communication which hates to be ‘burdened’ with too much nuance.
Simplistically put, R0 is the average number of people who will catch a disease from an infected person, in a population new to the disease. So, if R0 is 3, then on average, every case spawns 3 new cases. Simple? But distorting and misleading in fact.
At a macro level, we want R0 to be less than one, meaning the disease will then peter out. The pile-on to try and estimate R0 for COVID-19 has already led to several ‘outbreaks’ of undue alarm on social media.
 R0 today?
WHO plus six independent teams of researchers in the last week roughly all have congregated in their findings with ‘R’ estimates hovering between 2 and 3. WHO was actually a tad more conservative, with a span of 1.4 to 2.5. There was an outlier Chinese team whose estimates went from 3.3 to 5.5, and a British team that opened fire with a high average value of 3.8, before dialling it back as new data emerged to 2.5.
However, the 3.8 went ‘viral,’ being likened to, and I quote, from a Harvard epidemiologist no less as, “thermonuclear pandemic level bad”. He has since removed his tweet, which had already been gorged on 16,000 times by then.
The reason this is highly misleading is that many other diseases have R0 estimates that are in line with this: SARS (2 to 5), HIV (2 to 5), measles of course leads the pack (12 to 16).
Another reason to dial back the assumption mongering is that a bigger R0 does not necessarily mean a worse disease. Seasonal flu’s is 1.3 and yet it gets to millions each year. SARS was much higher and infected just over 8,000. The R0 is about potential only.
So, if higher than 1 you take the disease seriously. But R0 is also an average we are told. So, if the R0 is 2, each person could pass it on to 2 people. Or 1 person out of a group of 50 being a ‘super-spreader’ returns from Spring break and infects 100, while the 49 via social distancing or other practices, infect no one. Super-spreader events while tragic in and of themselves, are also easier to recognise due to their dramatic nature. Tackling SARS and MERS were aided by recognising such related super-spreader events.
R0 is also an approximation, as it is estimated without knowing how many infected people are asymptomatic or may not have reported their symptoms. Therefore, absent reliable data on that, the calculations actually made usually involve projections, flowing from simulations using a variety of different methods.
R0 variances
R0 also varies as we move further in an infection cycle, as people become more alert and so tend to move towards treatment or isolation much faster, thereby bringing down the number of people they infect, often dramatically…compared to say the early period of an outbreak, when no one is paying particular attention.
Note that the current R0 estimates we currently have, via these investigative teams, virtually all come from Wuhan, as per Kristian Andersen, a virologist at the Scripps Research Translational Institute. As our study extends to places that were far better aware of the infection, it will doubtless be significantly lower she points out.
So, once nations realise a disease’s potential, R0 is no longer destiny, even if there is interaction among people. Health care workers having proper protection, focused quarantines, handwashing, all make a measurable difference. This should anyway therefore allow ‘R,’ the actual transmission rate to move decisively towards ideally being at and then less than 1.
The problem with any COVID-19 prediction
At present, estimates for COVID-19 range from a death toll on par with the number of people who die from injury and violence annually and one that might be closer to a full-scale purge by an authoritarian regime or a classic medieval plague.
You would think it’s simple. Take the number dead and have that be equal to the susceptible portion of the population multiplied by the infection rate multiplied by the fatality rate. Unfortunately, when you try to populate the equation with data, you find there isn’t a single number to plug in for any of these!
Just before we dive in, we can see data entry anomalies are first. There are allegations that deaths are being under-reported, or over-reported, or being recorded using different protocols. Next there are testing inconsistencies, are we testing everyone who wants to be tested, or not? How much testing per population has been done?
Fatality rate
If you go to fatality rate, not easy to peg. Age is a huge factor, and so you try to adjust for the demographic make-up, and sometimes linked to that, or linked to pre-existing conditions are what are being called ‘comorbidities’. These are underlying diseases and conditions that can exacerbate COVID-19 or be exacerbated by it.
So, there is no one ‘fatality rate’. A country with greater incidence of diabetes, say Sri Lanka and the United States, will have a different fatality rate, this would suggest, than those that don’t. But there may be other comorbidities affecting even the relative outcome in these societies. There may also be different levels of developed immunological defences based on a variety of factors.
So, is the fatality from coronavirus known strictly speaking or not? We almost certainly don’t know.
Partially this is also because we don’t know the number infected so we can compare that with the number of people who have died, as many may not have been tested, or may be asymptomatic. So aggravatingly, as an attempt at a ratio, even if our numerator were more or less reliable, we don’t know much about the denominator.
As written about earlier, the Diamond Princess, which was quarantined after the outbreak was recognised as such, had nearly everyone tested, and is a remarkable, virtually unique test case. It became a living lab. Therefore, we could ascertain those evidently infected as well as those infected but completely asymptomatic (who would normally have gone unrecognised and therefore uncounted).
On this basis, we can rationally say death rates are likely lower than we know, as there are a lot of people walking around with this infection who don’t know it. The Diamond Princess fatality rate for those with symptoms (a largely elderly population) was 2.3 %, and for all those infected (including the asymptomatic) it was 1.2%.
As also written about earlier, in Iceland, a company called deCODE Genetics offered free screenings to the general, asymptomatic public on 13 March. As of end of March, deCODE identified 71 infected people in a sample of 8,694 tests, essentially asymptomatic infections (.82%). The ratio between symptomatic and asymptomatic will have a considerable effect therefore on fatality rate calculations.
Yet another contributor to fatality rate is the quality of care given to those grievously ill. That has to do with hospital and medical capacity, and as demand exceeds supply say for ventilators, that can cause grave impact.
Hence, we are swimming in uncertainty due to all of the above.
Infection rate
We’ve said a lot about this already. To sum up, this will be influenced, beyond the disease, by social behaviours, local environmental details and political decisions.
Rate of contact is a variable, hence social distancing, but also urban density per se. Rate of transmission per contact is another moving target as the alluded to ‘superspreader’ events, for example, intervene (think the Biogen conference in Massachusetts, or the lady in South Korea who became a one-woman tipping point).
We are currently hypothesising, based on slightly uneven but not irrelevant data, that asymptomatic carriers are less infectious than those showing symptoms, so if this continues to be confirmed, that too will influence transmission rate.
Virus biology, the type of space or surface it lands on, transmission through the air, and more skew things further – and there are competing estimates on most of those variables as of this writing.
We then come to duration of infectiousness, and when during the disease’s progression the infected are actually infectious. Individual immune systems as well as virus biology play their parts in that according to Mark Weir, Director of Ohio University’s ecology, epidemiology and population health programs.
R0 also is premised on everyone being potentially susceptible. As a still relatively novel virus, we don’t know that. Then, how about ‘reinfection’? It is being assumed that once you have it, you are immune and cannot carry it either. This however is not currently fully settled medicine, or science, though remains the prevailing view. It is quite likely as the only real indication as of now otherwise is anecdotal from Wuhan from a few post-recovery cases, where data seems murky.
Then throw in all the adaptive measures, social distancing, preventive hygiene, reducing elective surgeries and treatment, deferring mass gatherings, do they in fact serve to drastically change the shape of the outbreak as we hope? It is very likely they do as demonstrated particularly where action was taken relatively early. So that further complicates any projections, and ought to interfere with any reflexive doomsday scenario spinning.
Of course, caution mandates we err, to the extent rationally feasible, on the side of protecting people. So, we hopefully realise we are here highlighting the need to be humble in the face of uncertain data, not campaigning for reckless complacency. Neither are merited on the facts as of today.
Therefore
Let us march carefully, but without a Panglossian ‘the world is coming to an end’ if we don’t shut down life as we know it fatalism. That could potentially precipitate the types of outcomes we were hoping to avoid through other routes (destruction of life via economic meltdown on a massive scale).
No ‘medical expert’ based on the survey provided above of what we know today can offer any definitive opinion, and no one worth their salt would aim to. They can advise, they can conjecture, and we should be illuminated by their counsel, particularly if we listen to a cross-section of informed medical hypotheses. However, as of today, due to the above, the more definitive and absolutist the pronouncement, the more there is an ‘agenda’ lurking or sheer quackery afoot.
Sound the warning trumpets, yes, advise prudence and an intelligent brew of suppression and mitigation. And whether using the terminology of ‘hammer and dance’ (though please note it cannot be all ‘hammer’ and no ‘dance!’) or the ‘brakes’ metaphor from Singapore, we have to manage to keep both imperatives paramount: to keep as many people alive first as we possibly can AND also solvent enough to be able to viably remain alive!

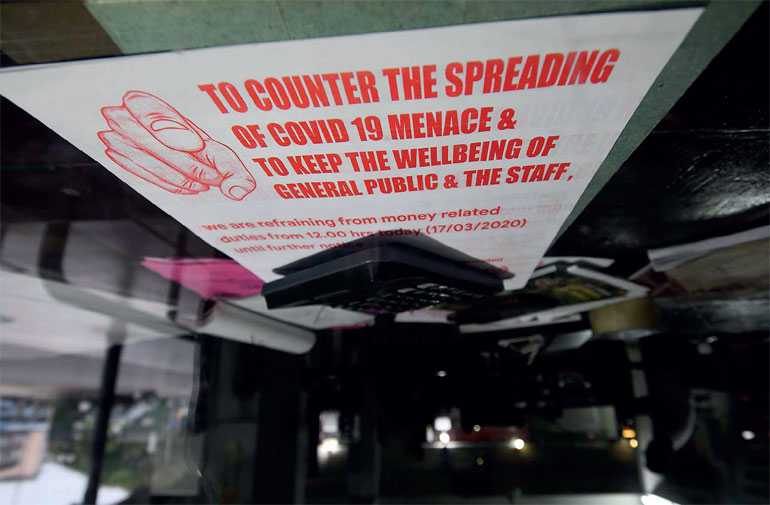
As of 3 April, COVID-19 is nowhere on the top 20 death causes to date in 2020. As against 53,198 COVID-19-related or I should say COVID-19-ascribed deaths, number 20 on the ‘top 20’ list of killers is birth asphyxia and birth trauma, shown responsible for 189,901 deaths to date in 2020 – Pic by Shehan Gunasekara