Thursday Jun 25, 2026
Thursday Jun 25, 2026
Wednesday, 10 February 2021 00:10 - - {{hitsCtrl.values.hits}}

Security analysts make predictions on earnings, forecast long term share price trends and try to anticipate future share prices
 Introduction
Observations raise a compelling empirical motivation for the researchers to investigate Do Sell Side Security Analysts (SSSA) can forecast earnings, stock recommendations, target prices and particularly consensus prices (average target prices) accurately. If so, do investors have the ability to earn abnormal returns using SSSA forecasts?
Security analysts make predictions on earnings, forecast long term share price trends and try to anticipate future share prices. Thus, prediction of a share price is an interesting area over the past years by economists, statisticians and teachers of finance through “chartist” or “technical” analysis and “fundamental” or “intrinsic” value analysis.
Further, security analysts engage daily in the operations of the stock market and have contacts with both the business and financial communities with extensive information, so that they have monopolistic access to private information to execute their exceptional artistic skill in forecasting (Fama, 1991).
Forecasting is a tedious task, once an American writer Mark Twain describes it is an art, where he uses the specific word to describe it as “prophecy”, particularly in terms of future. The security analyst acts as “prophet” in this regard, they predict future states of a firm based on information, most of which are not available to an ordinary investor. However, the ability to generate abnormal returns using security analysts’ forecasts depends on the stock market definition.
1.2. Sell side security analysts forecasts and abnormal returns
Müller-Bloch and Kranz (2014) state that there are conflicts of ideas in research findings in the empirical studies. Scholars from the domain of finance literature give insights about the different outcomes of the empirical studies done to test the ability to earn abnormal returns using security analysts’ recommendations, earnings forecasts and target price forecasts.
The studies by Barber et al. (2003) find that investors are not able to earn abnormal return using security analysts’ forecast. In contrary Asquith et al. (2005) conclude that investors can earn abnormal returns based on analyst forecasts. Thus, the researcher recognises the gap in prior research after careful examination of conflicting arguments raised by the scholars concerning the ability to earn abnormal returns using security analysts’ recommendations, earnings forecasts and target price.
1.3. Public information vs. private information
The empirical findings suggest that investment professionals including pension fund managers, mutual fund managers and investment managers able to earn extra returns over the benchmark since their forecasts are based on private information (Potocki & Swist, 2012). A domineering argument made by McNichols (1989), states that investors have information about a firm's future earnings beyond that of its management by accessing information sources through SSSA.
The argument suggests that security analysts possess information to foresee the future of the firm better than its management. Similarly, there are evidence that SSSA tends to disclose recommendations and target prices in favor of the management to access private information (Rees, Sharp & Wong, 2017).
However, once the target prices or consensus prices and stock recommendations publishes online on financial service companies’ websites such as Wall Street Journal, Financial Times, Reuters, Dow Jones, CNN and Bloomberg, all the information including private information gather by the SSSA eventually become publicly available to all investors in the market (Stickel, 1995; Womack, 1996). So that anyone has an interest in obtaining the information regarding stock recommendations and target prices of securities can access to the information without incurring an additional cost.
Nevertheless, in the Sri Lankan context, Colombo Stock Exchange (CSE) is categorised as a frontier market by the Financial Times Stock Exchange (FTSE) and Morgan Stanley Capital International Index (MSCI). Further, the study by Abeysekara and Nimal (2017) considers CSE as a frontier market based on economic growth and development that prevails in the country during the study period. The MSCI (2018) states that in a frontier market ‘the cost of information’ is high when it compares to the developed and developing markets. Thus, in the Sri Lankan context, even though security analysts’ forecasts publish online on financial service companies, (e.g., Bloomberg, Thomson Reuters and FactSet) it is costly to get access to such information by an ordinary investor.
The validity of the argument develops by the researcher ensures the soundness of the efficient market model where the researcher needs to ask whether access to such private information pays for the average investor or the average economist to spend resources to search out the unknown information (Fama, 1970). Thus, a stock is worth analysing only when its information value above a certain minimum value decided by the investor after taking into account, the opportunity cost and benefit of including a particular stock into the investment portfolio (McNichols & O’Brien, 1997).
One possibly will argue that insider trading based on private information prohibits in Sri Lanka as well as most of the countries in the world. However, the findings of the empirical studies do not recognise market professionals as corporate insiders (Haddock & Macey, 1987). Notably, they propose that market professionals should allow trading on private information since it creates more liquidity in stock markets and stimulates competition in the acquisition of information, thus SSSA do not use the private information to earn an abnormal return for themselves. The discussion fetches empirical evidence concerning the subject under discussion through four avenues. Thus, in the present study, the researcher’s exertion is to test whether investors can earn abnormal returns using the information contained in the SSSA consensus price. Moreover, the consensus price information can be accessed only to limited investors and categorise as “private information” in the context of Sri Lanka.
To synchronise the variables, use in the methodology the consensus return used as a proxy for consensus price in the study. Thus, in the present study, the researcher’s exertion is to examine the relationship between the information contained in consensus return and stock return. The research question formulates to address the research problem “Is there a relationship between stock return and consensus return in the context of Sri Lanka?” with the research objective articulate from research question is “To examine the relationship between stock return and consensus return in the context of Sri Lanka”.
2. Significance of the study
The significance and potential contribution of the present study can be discussed from both theoretical and practical standpoints. The study contributes to the new knowledge by ‘bridging the knowledge gap’ that exists in the practice into the finance theory by arguing SSSA forecasts are comprised of or private information.
The findings of the empirical studies, i.e., public availability of SSSA forecasts conduct in respect to developed and developing stock exchanges cannot be generalised into CSE, which is a frontier market. The empirical evidence suggests factors to distinguish between different markets as the number of investors and their behavioural characteristics, liquidity levels, legal and regulatory framework, institutional framework and market’s operational bottlenecks (Osei, 1998). The study has important implications for investors (local and foreign), stock brokering firms, security analysts, mutual fund managers, companies listed in CSE, regulatory authorities including government and academics.
Moreover, from the investor’s perspective, the findings of the study enhance the trustworthiness of the institutional, local and foreign investors in formulating investing strategies. Investors, especially foreign investors rely heavily on SSSA forecasts i.e., consensus prices publish on online financial service companies such as Bloomberg, Thomson Reuters and FactSet. The accuracy of consensus prices enhances investor confidence concerning the fortification of the value of their investment. The findings are valuable from the perspective of companies listed in the CSE to formulate suitable policy decisions. So, the inefficiency of CSE provides insight to market participants to create innovative financial products that improve investors' active market participation and develop the CSE and thereby Sri Lankan economy in the long run.
3. Data and methodology
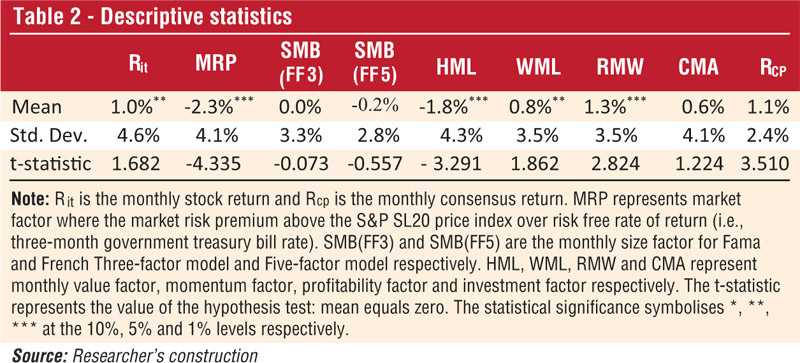
The purpose of the study is to identify the relationship between stock return (Rit) and consensus return (RCP) of individual securities. Based on that the study also attempts to investigate the investors’ ability to earn abnormal returns using consensus price and to test whether the companies listed in the S&P SL20 Index of CSE support for the strong form market efficiency.
3.1. The population and sample of the study
A population is the totality of cases that conform to some designated specifications, which could be people, events, or things of interest to the researcher (Sekaran, 2006). The population of the study includes public listed companies in CSE registered in a reputed financial service company, which are of interest to the SSSA in their equity research studies. Thus, all the listed companies cannot be considered as the population since there are companies that haven't used in the stock market research or equity research studies of the brokering firms.
The stock picking by the SSSA is based on the attractiveness of the stock to investors. The consensus price data is available in the research office of the reputed financial service company and for 44 public listed companies in Sri Lanka. The financial service company’s research team collects target price data from the written and electronic reports of registered brokerage firms and the system calculates the average target price i.e., consensus price and disseminates the information to required stakeholders. The unit of analysis (element) of the present study is at the individual company level. CSE is an emerging market with a small number of listed stocks (Kongahawatte & Nimal, 2015). Thus, the sample consists of all the companies of which the consensus information available.
The number of companies qualifying for the study is based on the sample selection criteria to limit the analysis to a realistic level. The study period or sample period was from 1 October 2012 to 30 September 2018. The data availability of the sample, the consensus price data should be available for at least three months or more for a year under study, i.e., a listed company should be under a research study by any registered stockbroker for a period of three months or more. Thus, in the present study, the sample selection is based on the criteria given above, disregarding whether the firm is a financial firm or a non-financial firm based on the empirical evidence. There are 22 listed companies, qualified for the study from 2012 to 2018.
3.2. Data collection and administration
The data used in the present study mainly consists of secondary data sources and data corresponding to CSE retrieve from data library CD publish by the CSE. The monthly consensus price data is also a secondary data source not available to the public, store in a reputed financial service company in Sri Lanka. The consensus price automatically generates from the financial company’s software based on manual and electronic research reports of stockbrokers.
The information regarding the constituent changes (inclusions and exclusions) to the S&P SL20 index obtains from the CSE press release data on the CSE website. The three-month Treasury Bill Rate (TBR) takes as a risk-free rate published by the Central Bank of Sri Lanka (CBSL).
3.3 Variable definition and hypothesis
The empirical studies have evidence that there is a direct relationship between stock return and consensus return. Hence, hypothesis develop by the researcher to examine the relationship postulate in the present study between Rit and RCP. Here hypothesis is H1: There is a statistically significant relationship that exists between Rit and RCP.
3.4. The relationship between stock return and consensus return
Fundamentally, the consensus price is the average target price forecasts by all the SSSA in the market for a given stock (Nasdaq, 2018). There is evidence in the literature that SSSA predict the consensus price through technical analysis, fundamental analysis and using different sources of private information about a firm. Thus, investors’ intention to purchase or sale of stocks is purely base on the SSSA consensus prices and it has a direct impact on the actual stock returns (Antônio et al., 2017).
Rit=C+RCP+εt
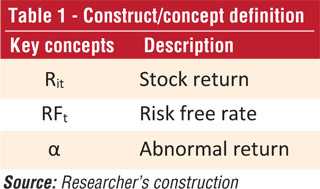
Where, Rit : Realise stock return for the stock i for the month t
RCP : Return based on consensus price for the stock i for the month t
C : Constant
εt : Error term
The new variable, consensus return recognises as a variable that affects the direction and strength of the relationship between dependent and independent variables. Thus, the consensus return (RCP) is the percentage change in the consensus price estimate in the month t and month ending t-1.

Where,
RCP : Consensus return for the stock i for the month t
CP1 : Consensus price of the stock at the end of the month t
CPo : Consensus price of the stock at the end of the month t-1
3.5. Measurement of dependent variable
The dependent variable of the present study is monthly Rit. So, the monthly share prices at the end of each month of the S&P SL 20 companies listed on the CSE use to calculate Rit. In year 2006, Nimal uses a formula in his study to adjust the daily stock returns in the form of remittances such as dividends, bonus issues, stock splits and right issues, with the assumption that any form of remittances are reinvested at the earliest possible time in the same stock (Abeysekara & Nimal, 2016, 2017). Thus, evidence suggests that the selection of return calculation method is depending on the assumptions made by the researcher.
In calculating monthly stock returns, the researcher assumes that any form declaration of remittances such as dividends, bonus issues, stock splits and right issues encourage investors to purchase the stock and it causes the price of a stock to increase. In general, the increase is about equal to the amount of the benefit, however, the actual price change is based on market activity. Thus, it is reflected in the share price appreciation and incorporate into the return calculation.
Where,
Rit : Return of the stock i for the month t
P1 : Price of the stock at the end of the month t
Po : Price of the stock at the end of the month t-1
3.6. Measurement of market return
The empirical evidence suggests that SSSA do not consider all the listed companies in a stock market in the analysis and are based on the attractiveness of the stock to investors (Lehavy et al., 2011). Thus, the study confines only to the S&P SL20 as evidence suggest i.e., companies representing the characteristics of high liquidity and high market capitalisation among 299 listed companies in CSE. In the present study, the individual stock return calculates as a percentage change in monthly share prices assuming that capital gains, dividends and other forms of remittances are reinvested at the earliest possible time in the same stock. So, the percentage change in the S&P SL20 Index used as a proxy to the market return to better represent the market fluctuations. The present study sample limits S&P SL20 companies thus, it accurately represents the market return of securities listed in the S&P SL20 Index. as a proxy for the market return to better represent the stock return.

Where,
RMt : Return of the market portfolio at month t
S&P SL20t : Value of the S&P SL20 Index at the end of month t
S&P SL20t−1 : Value of the S&P SL 20 Index at the beginning of month t-1
(To be continued)