Wednesday Jul 08, 2026
Wednesday Jul 08, 2026
Monday, 18 May 2020 00:00 - - {{hitsCtrl.values.hits}}
Sri Lanka’s trade deficit shrank to $ 574 million in February, significantly less than the January deficit of $ 730 million, on early signs of COVID-19 impact, latest Central Bank data showed, even though exports grew by 0.7% to $ 988 million when compared with a year ago.
On a cumulative basis, the trade deficit widened to $ 1,304 million during the first two months of 2020 compared to $ 1,069 million in the corresponding period of 2019. The trade deficit of $ 574 million in February was higher than the $ 451 million recorded a year ago.
Meanwhile, terms of trade, i.e., the ratio of the price of exports to the price of imports, deteriorated by 3.5% (year-on-year) in February, as export prices declined at a faster pace than the decline in import prices. Earnings from merchandise exports increased in February for the first time since June 2019 by 0.7% to $ 988 million, year-on-year, led by the increase in industrial exports though agricultural and mineral exports declined in comparison to February 2019.
Earnings from industrial exports increased in February in comparison to February 2019. Higher prices and increased quantities of bunker and aviation fuel helped earnings from petroleum product exports to grow considerably in February.
Despite the decline in earnings from garment exports from the US, export earnings from textiles and garments increased, albeit marginally, due to increased exports of textiles and other made up textile articles. Export earnings from other major sub categories such as machinery and mechanical appliances, rubber products, food, beverages and tobacco also recorded increases during the month.
However, export earnings from gems, diamonds and jewellery, wood and paper products, leather, travel goods and footwear, base metals and articles, chemical products and transport equipment declined compared to February 2019.
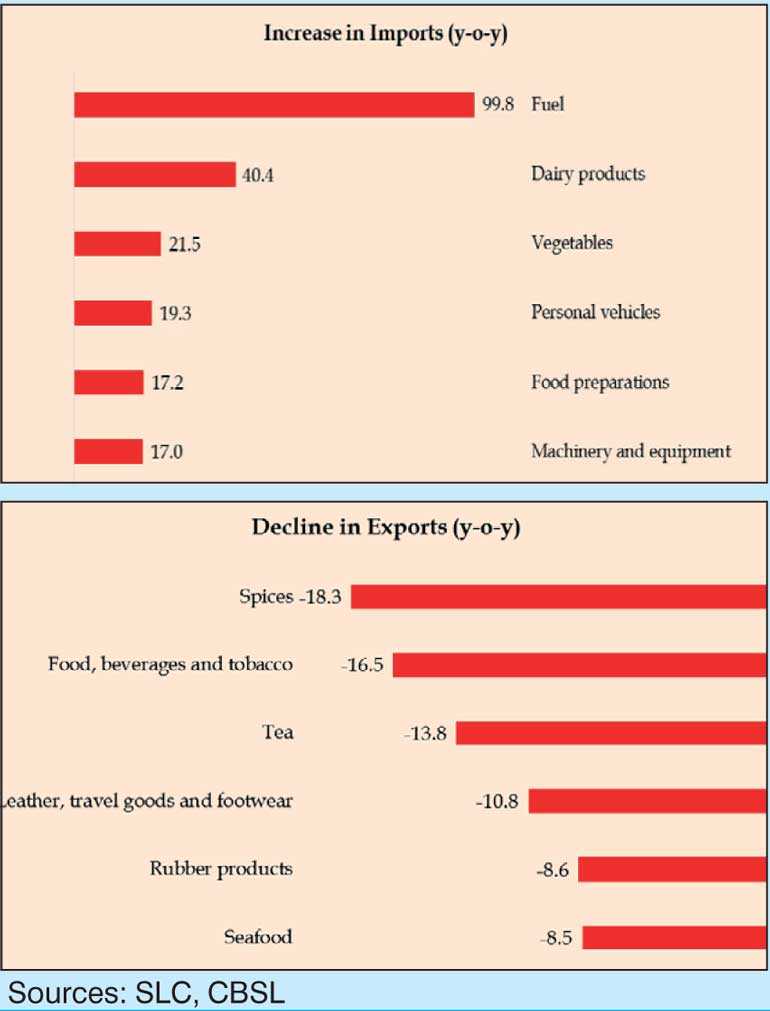
Earnings from agricultural exports declined in February, on a year-on-year basis. Lower volumes exported led earnings from spices and coconut to decline in February, while lower average export prices resulted in earnings from tea exports to decline.
Amidst lower demand from the US and the EU, earnings from seafood exports also declined in February. In contrast, earnings from export of minor agricultural products and natural rubber increased notably during the month.
Earnings from mineral exports recorded a decline in February, year-on-year, led by lower earnings from earths and stone exports.
The export volume index in February improved by 5.2%, while the export unit value index declined by 4.2%, indicating that the increase in exports was driven entirely by higher volumes when compared to February 2019. Expenditure on merchandise imports increased notably, on a year-on-year basis, in February for the third consecutive month, though recorded a decline on month on month basis.
Accordingly, expenditure on imports increased by 9.1% to $ 1,562 million in February driven by higher consumer and intermediate goods imports partly due to the lower base recorded in February 2019. However, expenditure on non-fuel imports declined, indicating that the increase in import expenditure was driven by fuel imports.
Expenditure on consumer goods imports increased in February, on a year-on-year basis. Under food and beverages, dairy products (mainly milk powder), vegetables (mainly big onions and potatoes), sugar, spices (mainly chillies) and beverages (mainly alcoholic beverages) imports increased. Under non-food consumer goods category, expenditure on the importation of personal motor vehicles and most of the items in other subcategories increased on a year-on-year basis, in February due to the base effect.
Expenditure on imports of intermediate goods also increased in February, from a year earlier. Higher volumes of crude oil, refined petroleum and coal imports led expenditure on fuel to increase during the month, although average import prices remained low compared to February 2019.
Expenditure on food preparations (mainly palm oil), rubber and articles thereof, fertiliser (mainly urea), chemical products imports also increased in February. However, textiles and textile articles imports declined significantly, led by lower imports from China due to supply chain disruptions amidst the COVID-19 pandemic.
Meanwhile, expenditure on investment goods imports declined in February compared to February 2019. Expenditure on machinery and equipment imports declined, although machinery and equipment parts imports increased notably.
Expenditure on transport equipment and building materials also declined.
The import volume index increased by 10%, while the unit value index declined by 0.8% in February, indicating that the increase in imports was driven entirely by higher volumes when compared to February 2019.
The rupee, which remained stable until mid-March, depreciated sharply during the latter part of March up to mid-April, mainly due to adverse speculation in the market with the spread of COVID-19 outbreak. However, the exchange rate gradually stabilised, with a notable appreciation in the first week of May. Accordingly, the rupee recorded a depreciation of 3.4% against the dollar by 15 May.
Reflecting cross-currency movements, the rupee depreciated against the Japanese yen while appreciating against the euro, the pound sterling, the Canadian dollar, the Australian dollar and the Indian rupee during the year up to 15 May.