Wednesday Jul 15, 2026
Wednesday Jul 15, 2026
Saturday, 10 October 2020 00:02 - - {{hitsCtrl.values.hits}}
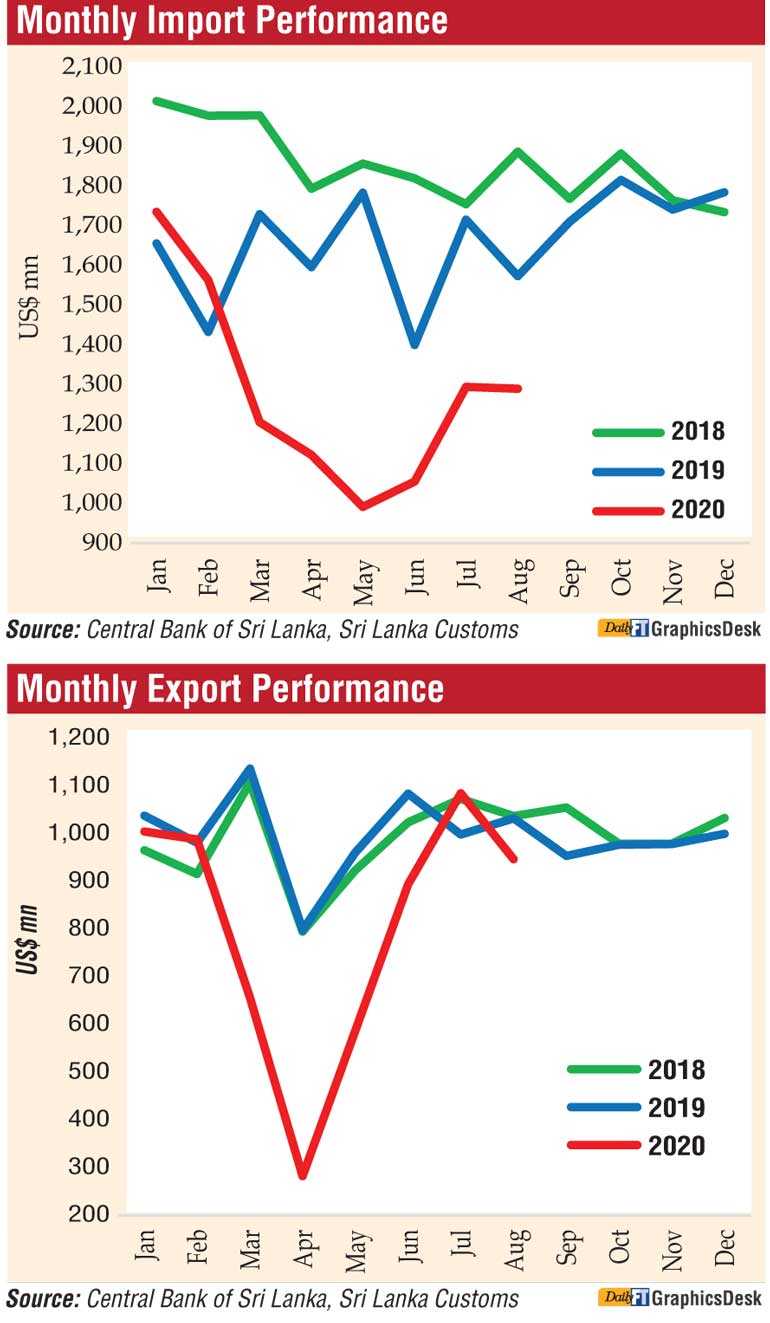 In the first eight months of 2020, Sri Lanka’s trade deficit shrank by $ 1 billion to $ 3.8 billion from $ 4.8 billion in 2019, helped by import restrictions and strong export performances since June with the latest numbers of $ 947 million in August helping the decline despite it being a weaker performance than the preceding months, latest data from the Central Bank showed yesterday.
The deficit in the trade account in August narrowed to $ 342 million from $ 541 million in August 2019, as imports declined at a faster pace than the decline in exports. Also, on a cumulative basis, the trade deficit narrowed by over $ 1 billion to $ 3,812 million during the period from January to August from $ 4,855 million in the corresponding period of 2019.
Meanwhile, terms of trade, i.e., the ratio of the price of exports to the price of imports, improved by 4.6% (year-on-year) in August as import prices declined at a faster pace than the decline in export prices, the latest External Performance report from the Central Bank said.
“Although export performance remained robust considering the current global market conditions, earnings from merchandise exports declined both on a year-on-year basis as well as on a month-on-month basis in August. Accordingly, merchandise exports declined to $ 947 million in August compared to $ 1,033 million recorded in August 2019 and $ 1,085 million recorded in July. The year-on-year decline emanated from declines recorded in earnings from all three major categories of exports, namely, industrial, agricultural, and mineral exports.”
Industrial exports declined by 10.2%, year-on-year, in August mainly due to reduced earnings from exports related to textiles and garments, petroleum products, gems, diamonds and jewellery, leather, travel goods and footwear, and base metals and articles. Earnings from textiles and garments declined by 11.9% in August, led by lower garments exports to the US and the EU. However, a notable increase was recorded in earnings from personal protective equipment (PPE) such as face masks and protective suits, which are categorised under other made up articles. Earnings from petroleum exports declined, with lower bunkering quantities and prices.
Meanwhile, earnings from rubber products declined, due to the decline in earnings from tyre exports although earnings from surgical and other gloves exports increased. In contrast, earnings from subcategories of plastics and articles thereof (mainly due to plastic clothing articles), and food, beverages and tobacco (mainly due to value added coconut products, such as liquid coconut milk, coconut cream and coconut milk powder) increased during the month of August.
Earnings from agricultural exports declined marginally on a year-on-year basis in August. The decline in the overall earnings from agricultural exports led by tea exports, which declined considerably by 13.3%, followed by seafood and rubber. Earnings from exports of tea declined due to the low export volume in spite of higher prices observed during the month of August compared with the corresponding period of previous year.
Except these three subcategories, all other subcategories of agricultural exports recorded increases. Earnings from spices exports increased, led by higher export volumes of cinnamon and cloves in August compared with August 2019. Earnings from coconut exports increased, with increases in both kernel and non kernel products. Earnings from minor agricultural products increased in August compared with August 2019, as earnings from areca nuts continued to maintain the year-on-year increasing trend observed since September 2019.
Earnings from mineral exports declined in August, year-on-year, led by lower earnings from ores, slag and ash exports, although earnings from earths and stone exports increased.
The export volume index improved by 3.2%, on a year-on-year basis, while the unit value index deteriorated by 11.2%, on a year-on-year basis, in August, indicating that the year-on-year decline in earnings from exports was, on average, driven by lower export prices.
Continuing the year-on-year declining trend observed since March, merchandise imports recorded a decline of 18.1% to $ 1,289 million in August. The continuation of measures taken by the Government to restrict the importation of selected non-essential goods and lower fuel prices in the international market primarily caused this decline.
The expenditure on consumer goods declined, led by both food and beverages and non-food consumer goods imports. The non-food consumer goods imports declined with lower expenditure on all subcategories except telecommunication devices (mainly due to mobile phones). Expenditure on personal vehicle imports declined considerably by 98.4% in August. Import expenditure on food and beverages declined in August, led by dairy products (mainly milk powder), vegetables (mainly big onions), seafood (mainly canned fish), fruits (mainly apples and grapes) and beverages (mainly alcoholic beverages). However, import expenditure on oils and fats (mainly coconut oil), spices (mainly chilies), sugar and cereals, and milling industry products (mainly malt) increased during the month of August when compared with August 2019.
“The expenditure on intermediate goods imports declined in August, year-on-year, due to declines recorded in most of subcategories, including textiles and textile articles (-16.7%), fuel (-5.2%), and fertiliser (-74.4%). The reduction in expenditure in fuel imports was mainly due to lower petroleum prices in the international market while higher import volumes of crude oil and refined petroleum were observed in August compared to the corresponding period of the previous year. The average import price of crude oil declined to $ 47.74 per barrel in August from $ 64.78 a year ago,” the report added.
Meanwhile, the reduction in import expenditure of textiles and textile articles was led by lower imports of fabrics, fibres and yarn. Further, expenditure on all other subcategories under intermediate goods except wheat and maize, food preparations, agricultural inputs, mineral products and unmanufactured tobacco also declined in August compared to August 2019.
The expenditure on investment goods declined notably, with declines in all subcategories in August, on a year-on-year basis. Accordingly, expenditure on machinery and equipment (mainly telecommunications devices), building material (mainly iron and steel, articles of iron and steel and cement), and transport equipment (mainly commercial vehicles such as auto trishaws, tankers and bowsers) declined in August when compared with August 2019.
Both the import volume index and the unit value index declined by 3.6% and 15.1%, respectively, on a year-on-year basis in August, indicating that the decrease in import expenditure was caused both by lower volumes and lower prices.
The level of gross official reserves amounted to $ 7.4 billion as at end August, which was equivalent to 5.1 months of imports. Total foreign assets, which consist of gross official reserves and foreign assets of the banking sector, amounted to $ 10.3 billion at end August, providing an import cover of 7.2 months. The rupee, which appreciated since mid-April, recorded a marginal depreciation of 0.3% during August after demonstrating some volatility in the middle of the month.
The overall depreciation of the rupee thus far during the year up to 9 October was 1.4%. The Central Bank continued to intervene in the domestic foreign exchange market with a view to building up gross official reserves. During the year up to end September, the Central Bank absorbed $ 255.1 million, on a net basis.
Meanwhile, reflecting cross-currency movements, the rupee depreciated against the euro, the pound sterling, the Japanese yen and the Australian dollar, while appreciating against the Indian rupee during the year up to 9 October.
