Wednesday Jun 24, 2026
Wednesday Jun 24, 2026
Thursday, 19 October 2017 00:00 - - {{hitsCtrl.values.hits}}
Sri Lanka’s external sector showed a mixed performance in August 2017, the Central Bank disclosed yesterday.
It said although export earnings increased in August 2017, higher growth in import expenditure resulted in an expansion of the trade deficit. Despite the increase in tourist earnings in August 2017, the decline in workers’ remittances, together with the expanded trade deficit, dampened the performance of the external current account.
However, the financial account of the Balance of Payments (BOP) was supported by the receipt of the second tranche of the foreign currency term financing facility to the Government along with continued foreign inflows to the Colombo Stock Exchange (CSE) and the government securities market in August 2017.
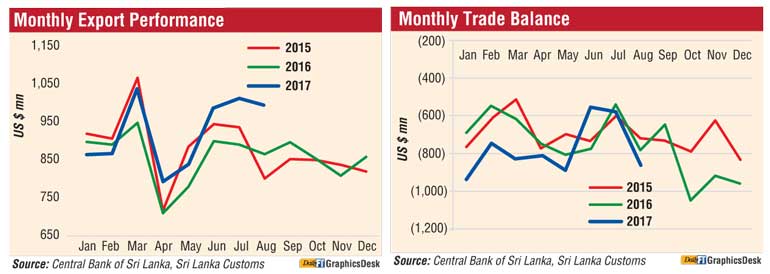
Surpassing the $ 1 billion mark for the second consecutive month, earnings from exports increased in August 2017, indicating the positive impact of the restoration of the GSP+ facility. Accordingly, earnings from exports increased by 15.5% (year-on-year) to $ 1,001 million in August 2017 mainly due to an increase in industrial exports followed by agricultural exports.
Earnings from industrial exports grew by 13.1% year-on-year to $ 740 million in August 2017 owing to the increase in exports of textiles and garments. Export earnings from textiles and garments increased by 10.1% year-on-year to $ 433 million with improved garment exports to the EU market.
Accordingly, earnings from garment exports to the EU market increased by 12.2% year-on-year to $ 186 million in August 2017, contributing more than 68% to the growth of garment exports. Meanwhile, garment exports to the US and non-traditional markets also grew by 4.4% and 4.6% year-on-year respectively during the month.
Further, earnings from the export of petroleum products increased significantly by 74.2% year-on-year in August 2017, owing to higher export volumes and prices of bunker and aviation fuel. In addition, the export earnings from food, beverages and tobacco increased significantly by 35.8% year-on-year to $ 35 million, due to increased exports of vegetable, fruit and nuts preparations.
Meanwhile, export earnings from gems, diamonds and jewellery (23.6%), machinery and mechanical appliances (14.0%), and rubber products (4.1%) increased during the month compared to the corresponding month of the previous year. However, export earnings from base metals and articles, printing industry products and transport equipment declined in August 2017.
Earnings from agricultural exports increased substantially by 22.8% year-on-year to $ 255 million in August 2017, reflecting improved performance in almost all subcategories. Export earnings from tea increased significantly by 20.6% year-on-year to $ 131 million, mainly due to higher prices in the international market despite the reduction in exported volumes.
In line with higher tea prices in the international market, the average export price of tea increased by 22.3% to $ 5.29 per kg in August 2017 from $ 4.33 per kg in August 2016. The volume of tea exports declined by 1.3% to 24.8 kg million in August 2017 from 25.1 kg million in August 2016.
Meanwhile, earnings from spices increased considerably by 40.5% year-on-year during the month, mainly due to the increased export volumes of pepper, cinnamon and cloves. Reflecting the positive impact of the removal of the ban on exports of fisheries products to the EU market and the restoration of the GSP+ facility, earnings from seafood exports increased considerably by 38.6% year-on-year to $ 18 million in August 2017, with an 81.9% year-on-year growth in exports to the EU market.
On a cumulative basis, earnings from exports grew by 7.6% year-on-year to $ 7,413 million during the first eight months of 2017 mainly due to increased earnings received from exports of tea, petroleum products, transport equipment, spices and seafood.
In contrast, on a cumulative basis, export earnings from textiles and garments, gems, diamonds and jewellery and leather, travel goods and footwear declined during the period under consideration.
The US, the UK, India, Germany and Italy were the leading markets for merchandise exports of Sri Lanka during the first eight months of 2017, accounting for about 50% of total exports.
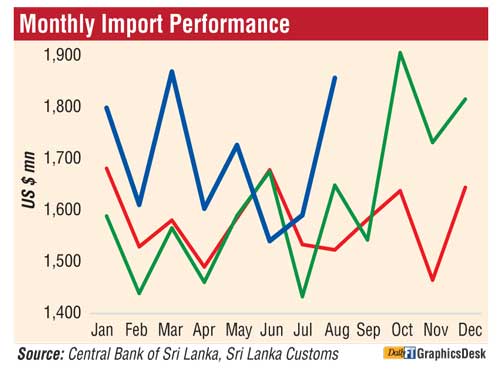
Import performance
Expenditure on imports increased by 12.6% year-on-year to $ 1,857 million, recording the second highest import value so far during the year, owing to the higher expenditure incurred on intermediate goods, particularly fuel expenditure on intermediate goods imports increased significantly by 23.9% year-on-year to $ 1,021 million in August 2017, mainly due to the increase in expenditure on imports of fuel by 73.0% year-on-year to $ 312 million.
This was largely driven by the significant increase in refined petroleum imports by 110.9% to $ 233 million. In addition, reflecting the impact of high crude oil prices in the international market, import expenditure on crude oil increased by 12.2% despite a reduction in volume.
Accordingly, the average import price of crude oil was recorded at $ 53.07 per barrel in August 2017 compared to $ 46.71 per barrel recorded in August 2016. Further, expenditure on gold imports increased considerably by 50.0% year-on-year to $ 65 million during the month, owing to higher volumes of gold imports while expenditure on base metals increased by 52.6% year-on-year. Expenditure on textiles and textile articles increased by 7.9% year-on-year in August 2017 with higher expenditure incurred on the import of fabrics.
Meanwhile, higher imports of chemical products, wheat and maize and food preparations contributed largely towards the increase in intermediate goods imports during the month. However, import expenditure on mineral products and fertiliser declined by 54.8% and 30.4%, respectively in August 2017 compared to the corresponding month of the previous year.
Meanwhile, expenditure on consumer goods imports remained broadly unchanged at $ 394 million in August 2017. However, expenditure on food and beverages grew by 3.7% year-on-year in August 2017, mainly due to higher expenditure incurred on the importation of rice.
Continuing the year-on-year increasing trend, expenditure on rice imports increased in August 2017 following the measures taken to fulfil the shortage of rice in the domestic market. Meanwhile, import expenditure on vegetables, dairy products and fruits increased during the month.
In addition, import expenditure on household and furniture items and telecommunication devices categorised under non-food consumer goods also increased in August 2017. However, import expenditure on rubber products, beverages and spices recorded a decline in August 2017.
Import expenditure on investment goods increased by 2.1% year-on-year to $ 439 million in August 2017 reflecting higher imports of machinery and equipment, and building materials. Expenditure on machinery and equipment grew by 2.5% during the month, with a surge in imports of printing machinery, telecommunication devices and air conditioning machines.
Import expenditure on building materials increased by 6.8% year-on-year during this period owing to higher imports of iron and steel, articles of iron and steel, and ceramic products. However, import expenditure on transport equipment decreased by 10.0% year-on-year in August 2017, mainly due to lower imports of road vehicles such as auto trishaws and cabs for commercial purposes.
Reflecting these developments, on a cumulative basis, import expenditure increased by 9.6% year-on-year to $ 13,599 million during the first eight months of 2017 largely due to higher imports of fuel, gold and rice. However, import expenditure on machinery and equipment, personal vehicles and fertiliser declined during this period.
With regard to the origin of imports, India, China, the UAE, Singapore and Japan were the main import origins during the first eight months of 2017 accounting for about 59% of total imports.
Trade balance
The deficit in the trade balance widened to $ 856 million in August 2017 from $ 783 million in August 2016. Meanwhile, the cumulative trade deficit during the first eight months of 2017 expanded to $ 6,186 million from $ 5,515 million in the corresponding period of 2016.
