Sunday Jul 26, 2026
Sunday Jul 26, 2026
Friday, 29 September 2017 00:00 - - {{hitsCtrl.values.hits}}
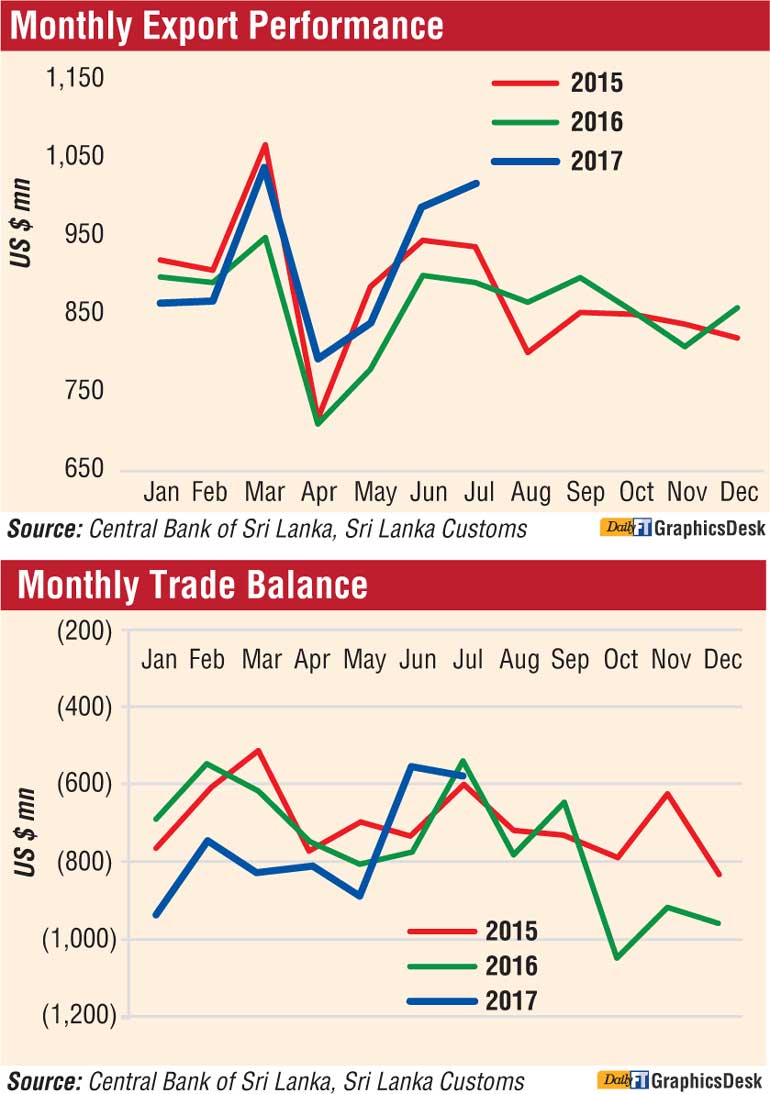
Exports grew almost 14% to pass $ 1 billion in July from a year ago, the second time this year they exceeded the billion-dollar target as exports grew for a fifth consecutive month, the Central Bank said yesterday.
Since March 2017 Sri Lanka’s exports have performed well, the bank said in its latest report. Earnings from exports grew to $ 1,016 million in July 2017, registering a year-on-year growth of 13.9%. The growth in exports was mainly driven by industrial exports followed by agricultural exports.
“Earnings from industrial exports grew by 11.6% year-on-year to $ 757 million in July 2017, led by increased exports of textiles and garments,” it said.
However, the deficit in the trade balance expanded to $ 575 million in July 2017 from $ 541 million in July 2016.
Meanwhile, the cumulative trade deficit during the first seven months of 2017 widened to $ 5,329 million from $ 4,732 million in the corresponding period of 2016.
Gross official reserves as at end July 2017 amounted to $ 6.7 billion, equivalent to 3.9 months of imports, while total foreign assets amounted to $ 9.0 billion, equivalent to 5.3 months of imports.
Earnings from industrial exports grew by 11.6% year-on-year to $ 757 million in July 2017, led by increased exports of textiles and garments. Indicating a reversal of negative growth experienced in the previous two months, export earnings from textiles and garments increased by 9.6% year-on-year to $ 467 million compared to July 2016, registering the highest monthly value recorded so far during the year.
Garment exports to the EU market increased by 10.6% year-on-year to $ 188 million in July 2017, signalling the positive impact of the restoration of the GSP+ facility in May 2017. During the month, garment exports to the US and non-traditional markets also grew by 7.9% and 6.5% year-on-year, respectively.
Meanwhile, export earnings from food, beverages and tobacco increased significantly by 46.8% year-on-year to $ 34 million. Further, reflecting the improved performance in all subcategories, export earnings from rubber products increased by 15.2% year-on-year in July 2017.
Due to higher export volumes and prices of bunker and aviation fuel, earnings from the export of petroleum products increased significantly by 21.5% year-on-year in July 2017. Meanwhile, export earnings from chemical products (led by perfumes), printing products (led by currency notes) and base metals and articles increased during the month compared to the corresponding month of the previous year.
However, export earnings from leather, travel goods and footwear, and gems, diamonds and jewellery declined in July 2017.
Earnings from agricultural exports increased substantially by 21.8% year-on-year to $ 253 million in July 2017 mainly due to the notable performance recorded in tea exports. Export earnings from tea increased significantly by 32.7% year-on-year to $ 143 million due to the combined effect of higher tea prices and volumes. The average export price of tea increased by 27.8% to $ 5.36 per kg in July 2017 from $ 4.19 per kg in July 2016 and $ 4.86 per kg reported at end 2016. The volume of tea exports grew by 3.8% to 26.7 million kg in July 2017, recording the highest export volume of tea so far during the year.
In addition, earnings from seafood exports increased considerably by 42.5% year-on-year to $ 20 million in July 2017, registering a 65.1% year-on-year growth in exports to the EU market. The notable performance in seafood exports indicates the positive impact of the removal of the ban on the exports of fisheries products to the EU market and the return of the GSP+ facility.
Meanwhile, export earnings from spices increased by 14% year-on-year during the month, reflecting higher volumes in almost all subcategories. However, earnings from exports of minor agricultural products, coconut kernel products and vegetables declined in July 2017.
On a cumulative basis, earnings from exports grew by 6.5% year-on-year to $ 6,413 million during the first seven months of 2017 due to increased earnings received from exports of tea, transport equipment, petroleum products, spices and seafood. In contrast, on a cumulative basis, export earnings from textiles and garments, gems, diamonds and jewellery and leather, travel goods and footwear declined during the period under consideration.
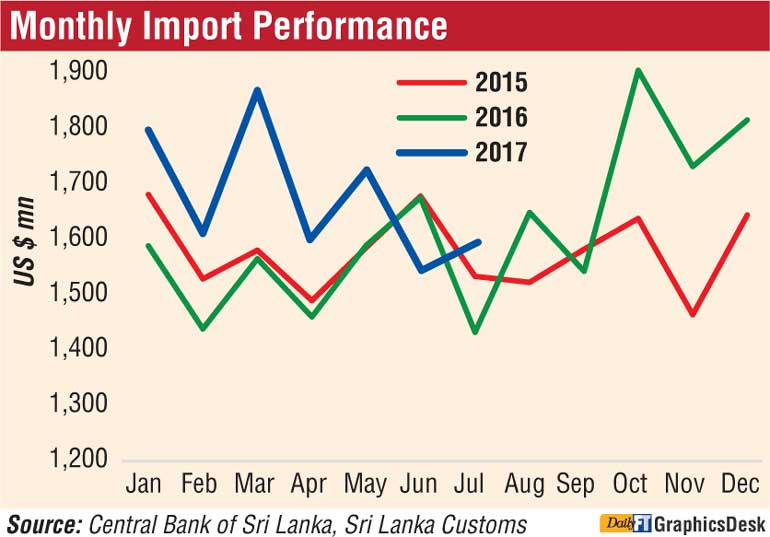
Expenditure on imports increased in July 2017 mainly reflecting the base effect of the lowest import value recorded in the corresponding period of the previous year.
Accordingly, expenditure on imports at $ 1,591 million registered a growth of 11.1% year-on-year in July 2017. Higher expenditure on intermediate goods largely contributed to this growth.
Expenditure on intermediate goods imports increased significantly by 28% year-on-year to $ 902 million in July 2017 mainly due to increased expenditure on imports of fuel, gold and textiles and textile articles. Expenditure on fuel imports increased considerably by 51.7% year-on-year to $ 216 million in July 2017, largely driven by higher imports of refined petroleum products.
Further, reflecting the impact of high prices of fuel in the international market, expenditure on crude oil imports increased by 2.8% in July 2017 despite a reduction recorded in import volumes. The average import price of crude oil increased to $ 49.75 per barrel in July 2017 from a purchase price of $ 46.10 per barrel in July 2016. Further, expenditure on gold imports increased substantially by 182% year-on-year to $ 62 million during the month, owing to higher volumes of gold imports.
Import expenditure on textiles and textile articles increased by 19.7% in July 2017 with higher expenditure on fabrics and fibres indicating the likelihood of increased exports of textiles and garments in the period ahead.
Meanwhile, higher imports of base metals, wheat and maize, and food preparations contributed largely towards increasing intermediate goods imports during the month. However, import expenditure on mineral products declined by 67.6% year-on-year in July 2017, reflecting the base effect owing to high imports of cement clinkers in July 2016.
Meanwhile, expenditure on consumer goods imports increased by 3.4% year-on-year to $ 334 million in July 2017 due to increased imports of food and beverages despite a decline in non-food consumer goods. Import expenditure on food and beverages grew by 10.2% year-on-year in July 2017, mainly due to higher expenditure incurred on the importation of rice.
Accordingly, although there was a reduction in average import prices, expenditure on rice imports continued to increase during the month due to the significant increase recorded in the import volume of rice following the measures taken to import rice to fulfil the shortage in the domestic market.
In addition, import expenditure on personal vehicles also increased by 15.9% year-on-year in July 2017 as a result of the increase in the importation of motorcycles and motorcars. Meanwhile, import expenditure on telecommunication devices and household and furniture items increased during the month.
However, import expenditure on spices, sugar, vegetables and clothing and accessories recorded a decline in July 2017.
Import expenditure on investment goods declined by 12.7% year-on-year to $ 352 million in July 2017, reflecting lower imports in all subcategories.
Expenditure on machinery and equipment declined by 13.2% during the month with the decline in imports of machinery and equipment parts, telecommunication devices, turbines and agricultural machinery.
Import expenditure on building materials also declined by 8.0% year-on-year during this period, owing to lower imports of cement, iron and steel, and articles of iron and steel.
Moreover, import expenditure on transport equipment decreased by 20.9% year-on-year in July 2017 mainly due to lower imports of road vehicles such as auto trishaws and cabs for commercial purposes.
Reflecting these developments, on a cumulative basis, import expenditure increased by 9.2% year-on-year to $ 11,742 million during the first seven months of 2017 largely due to higher imports of fuel, gold and rice. However, import expenditure on machinery and equipment, personal vehicles and fertiliser declined during this period.