Tuesday Mar 17, 2026
Tuesday Mar 17, 2026
Tuesday, 20 November 2018 00:00 - - {{hitsCtrl.values.hits}}
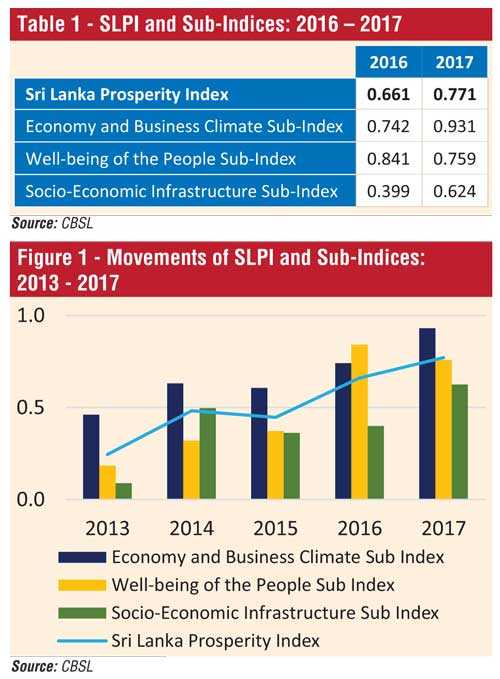 The Sri Lanka Prosperity Index (SLPI) increased to 0.771 in 2017 from the 0.661 recorded in 2016, mainly due to improvements in the Economy and Business Climate and Socio-Economic Infrastructure sub-indices.
The Economy and Business Climate sub-index has improved during 2017 due to an increase in per capita Gross Domestic Product (GDP) and enhancements of the aspects associated with employment. With regard to the sub-index of Socio-Economic Infrastructure, improvements to the road network with the extensions to the expressways, construction of bridges and flyover projects, availability of electricity facilities and improvements in pipe-borne water quality were the key drivers.
Even though the Well-being of the People sub-index had declined during 2017, mainly due to the reduced levels of purity of environment and air quality, improvements were recorded in the aspects of availability of healthcare facilities, availability and quality of education, wealth of people and their engagement in entertainment activities.
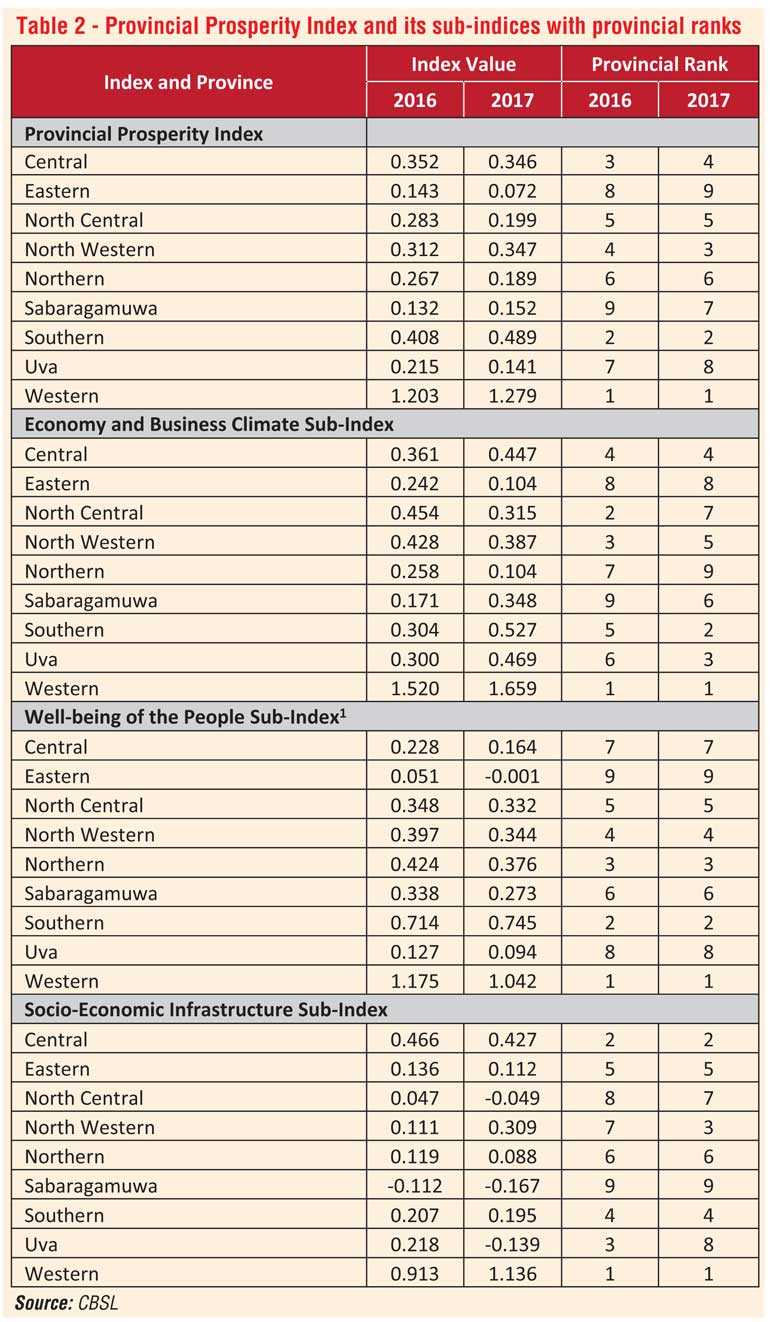
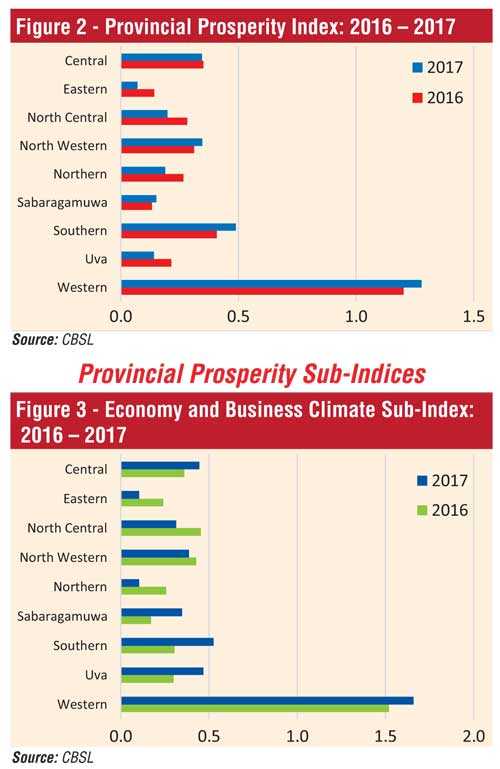
Provincial Prosperity
Provincial Prosperity indices, compiled to measure the level of prosperity across provinces, increased in the North Western, Sabaragamuwa, Southern and Western provinces. Meanwhile, enhancements in rankings could be observed in the North Western and Sabaragamuwa provinces. The provincial prosperity performances are given in Table 2.
Economy and Business Climate sub-Index
The Economic and Business Climate sub-index has improved in five provinces, namely the Central, Sabaragamuwa, Southern, Uva and Western provinces, mainly due to improvements in per capita GDP, high employment rate and increases in informal sector wages.
Meanwhile, high provincial inflation rates, slight increases in unemployment levels and a decline in industry and banking density have been observed as key drivers for the subdued performance in the Eastern, North Central, North Western and Northern provinces. 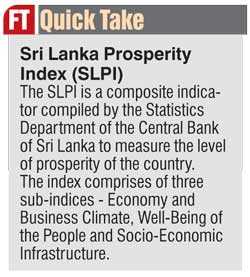
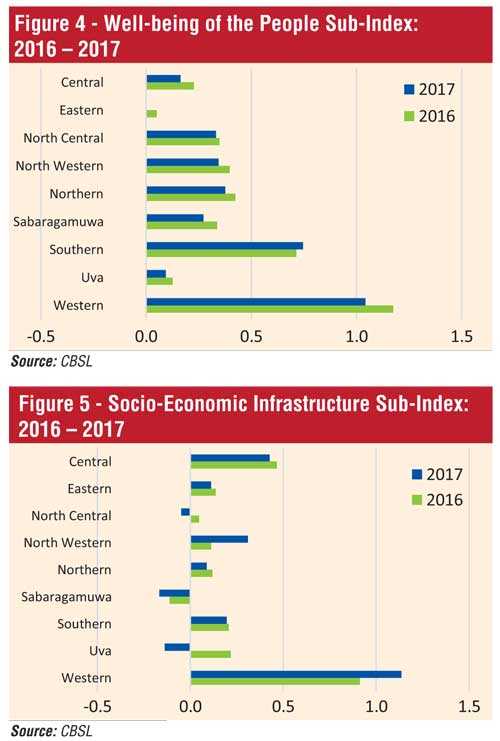
Well-Being of the People sub-index
The Well-Being of the People sub-index has improved only in the Southern Province, while declines were recorded in all other provinces. The improvement in the Southern Province was predominantly due to the higher performance in the aspects of availability and quality of education as well as in the measurement of wealth of people where vehicle ownership and access to supermarkets increased.
The decline of this sub-index in the rest of the provinces was mostly due to the adverse impact on the purity of the environment caused by the dengue epidemic which prevailed during 2017 and the low standards recorded in air quality, despite improvements in the aspects of availability of healthcare facilities, availability and quality of education, wealth of people and their engagement in entertainment activities.
Socio-Economic Infrastructure sub-index
Socio-Economic Infrastructure sub-index has recorded increases in Western and North Western provinces, mainly due to the improvements in road development with the construction of the Central Expressway project, the progress of the Rajagiriya, Ganemulla and Polgahawela flyovers, and the availability of electricity and telecommunication facilities.
Further, positive developments could be observed in the aspect of law and order as measured in terms of the number of crimes reported during 2017.
The deterioration of the Socio-Economic Infrastructure sub-index in the other seven provinces were mostly driven by the decline in the availability of Information and Communication Technology (ICT), telecommunication and transport facilities.
Technical note: The index
The SLPI is compiled using 43 variables which are categorised into three sub-indices. All the sub-indices have equal weights in SLPI and each variable bears an equal weight within the sub-index it belongs to.
 The Economy and Business Climate sub-index is compiled using nine variables categorised into the aspects of living standard, employment, income, poverty, price stability, sector-wise employment, industrial density and banking density.
In compiling the Well-being of the People sub-index, 22 variables pertaining to the aspects of availability of healthcare facilities, availability of education facilities, quality of available education facilities, wealth, availability and usage of entertainment facilities, air quality and purity of environment are used. The Socio-Economic Infrastructure sub-index includes 12 variables and the relevant aspects are the availability of electricity, availability of telecommunication facilities, availability of road coverage, crime-free environment, availability of transport facilities, availability of safe drinking water, quality of pipe-borne water, availability of ICT facilities, availability of sanitation and female participation in civic activities.
Methodology
Variables used in compiling SLPI are in the form of many different units of measurement. Therefore, all variables are transformed to a common scale by standardising data over past 10 years. Since the index values for the country and for the provinces are compiled separately, provincial indices cannot be compared with the country level indices. Thus, indices at the provincial level can be compared across provinces and time and the country level indices can only be compared across time.
The index values are compiled by standardising each and every variable with respect to the last 10 years. Therefore, the sign of an index value implies its positive or negative deviation compared to the respective mean. Thus, the negative values in the index do not imply that the prosperity levels are negative. (Source: Central Bank of Sri Lanka)