Wednesday Feb 25, 2026
Wednesday Feb 25, 2026
Thursday, 21 March 2019 00:00 - - {{hitsCtrl.values.hits}}
By Wimal Nanayakkara
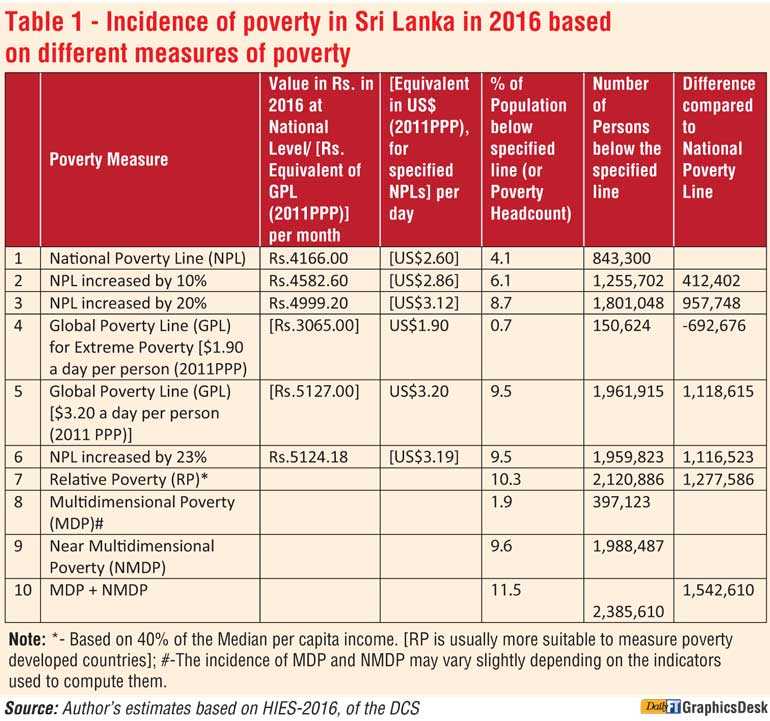
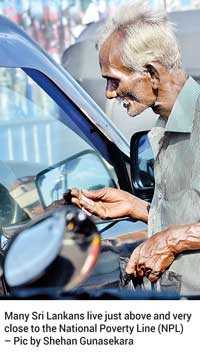
Sri Lanka has managed to bring down its poverty from 26.1% in 1990/91 to just 4.1% by 2016. However, it is not enough to consider only income poverty when monitoring poverty, as many are faced with multiple dimensions of poverty. It is important to note that many Sri Lankans live just above and very close to the National Poverty Line (NPL).
For example, more than 400,000 persons (Table 1) fall within 10% above the NPL and around one million persons live within 20% above the NPL. Although only 1.9% of the population in Sri Lanka are in multidimensional poverty (MDP), 9.5% are near MDP.
As such, it is important to have a broad look at poverty, when developing strategies to alleviate poverty. This blog briefly explains the methodology used in determining NPL and the Global Poverty Lines (GPLs), when estimating poverty in Sri Lanka. The methodology used in the determination of NPL is often debated and GPLs are misinterpreted when estimating poverty. As such, the blog attempts to clear some misconceptions on these poverty lines and stresses the importance of estimating poverty using different measures and dimensions.
It is also important to rebase the NPL, which was developed in 2004 based on Household Income and Expenditure Survey (HIES)-2002 of the Department of Census and Statistics (DCS), as the spending and consumption patterns of the poor groups change with time.
Determination of National Poverty Line (NPL) in Sri Lanka
The ‘Cost of Basic Needs (CBN)’ method, used in most developing countries to determine the NPL, measures absolute poverty. The CBN is made up of the cost of a consumption bundle, which includes both food and non-food items, that is adequate to meet the nutritional requirements of a population likely to be poor (or a reference group initially identified based on the HIES-2002 conducted by the DCS). The households in the 2nd to 4th deciles, ranked by real per capita total consumption expenditure are chosen as the reference group. The aggregates of food expenditures for all food items consumed by the “reference group” and their calorie intakes are then calculated. The cost per calorie is then derived by dividing the former by the latter.
 The average energy requirement has been estimated to be 2030 kilocalories per day, per person in Sri Lanka. The cost of meeting this requirement of energy per person, per month is computed by multiplying the per capita calorie cost by 30x2030 (i.e. 30 days x 2030 kilocalories). The Food Poverty Line, based on these computations was Rs. 973 per month in 2002. Unlike the Food Poverty Line, estimating the non-food component is more complex. It is estimated by taking the average of the median per-capita non-food expenditures of the reference group, whose per capita food expenditure is close to the Food Poverty Line and whose per capita total expenditure is close to the Food Poverty Line. This methodology was developed by a team of experts from the Sample Surveys Division of the DCS and two international experts.
The details on the methodology and the team of experts is found in Poverty in Sri Lanka: Issues and Options. As the spending and consumption patterns of the poor change with time, it is desirable to rebase the NPL using the latest HIES-2016, so that a more realistic estimates for poverty in Sri Lanka could be made.
Using poverty estimates based on global or international poverty line
Poverty measures based on global poverty lines attempt to hold the real value of the poverty line constant across countries. Initially the GPL used by the World Bank to measure extreme poverty was $1.08 a day (based on 1998 prices) and was referred as “a dollar a day”. This was widely accepted as the international standard for extreme poverty. This was replaced by the GPL $1.25 a day (based on 2005 prices). Subsequently, in October 2015, $1.25 a day PL was updated to $1.90 a day (based on 2011 prices).
There seems to be a misconception that the GPLs could be used to estimate poverty in Sri Lanka, by simply multiplying the GPLs by the exchange rate during the period in which HIESs have been conducted, to compute its value in local currency. This is totally false. For example, if extreme poverty is to be estimated, it is necessary to first convert $1.90 to local currency using 2011 Purchasing Power Parity (PPP).
The PPP conversion factor for private consumption (including consumption from own production), is the number of units of a country’s currency required to buy the same amount of goods and services in the domestic market as one $ would buy in the United States. After the GPL $1.90 a day is converted to local currency at 2011 prices, it needs to be inflated using the Consumer Price Index (CPI), to determine the value of the $1.90 a day in local currency, pertaining to the periods in which HIESs have been conducted, which amounts to only Rs. 3,065 per month per person in 2016, while the corresponding NPL was Rs. 4,166 [($2.60) 2011 PPP]. As such, if the GPL of $1.90 a day is to be used to measure extreme poverty in Sri Lanka, in 2016, only 0.73% of the population is in extreme poverty (Table 1 ), which could be checked, if necessary using PovcalNet.
The World Bank also uses $3.20 a day, poverty line to compare poverty in Lower Middle Income Countries (LMICs) and $5.50 a day in Upper Middle Income Countries. The main aim of GPLs is to compare the incidences of poverty at national level, among countries. These international poverty lines are generally not suitable for the analysis of poverty within a country. For that purpose, country specific poverty lines are needed, reflecting the country’s economic and social situations. To compare the status of poverty among regions within the country, it is more appropriate to use the National Poverty Lines, which also need to be rebased, as explained before. However, no single definition or poverty measure will ever be suitable to estimate all forms and dimensions of poverty in the country.
What do the poverty figures mean for Sri Lanka?
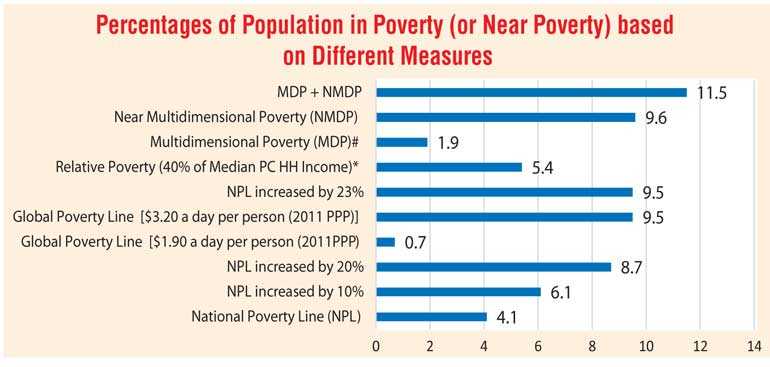
The table compares incidence of poverty based on NPLs, GPLs, RP and MDP, and NMDP. These estimates of the poor and near poor based on different measures show that at least 11.5% of the population in Sri Lanka is either poor or near poor in some form. The near poor could easily slip back to poverty due to any economic shocks, natural disasters, etc. All these estimates could be made at sector, district, as well as at different socio-economic groups, which would be useful in developing poverty reduction strategies, as there are huge variations in the incidence of poverty between regions and socio-economic groups.
[Wimal Nanayakkara is a Senior Visiting Fellow at the Institute of Policy Studies of Sri Lanka (IPS). To talk to the author, email [email protected]. To view this article online and to share your comments, visit the IPS Blog ‘Talking Economics’ - http://www.ips.lk/talkingeconomics/]

