Wednesday May 20, 2026
Wednesday May 20, 2026
Friday, 29 March 2019 00:00 - - {{hitsCtrl.values.hits}}
Today’s competitive business environment envisages timely information as a key resource for proactive decision making. If organisations do not have efficient and effective mechanisms to obtain right information at right time, the chances of succeeding in policy formation are remote. However, the official statistics of an economy, which are  considered central in decision making are released with a considerable time lag and are subject to revisions. Thus such information sometimes become outdated and less useful in decision making process. In the attempt to address this issue, various models have been developed by embodying linkages between economic variables implied by economic theories and observed statistics, to help in nowcasting and foreseeing the direction of an economy. However, such models still have limitations in explaining the real developments, especially, when nonstandard interactions drive the economy. One of the best examples to highlight the risk of totally relying on standard models in foreseeing economic trajectories and the future is the global financial crisis, where majority of models, which were highly sophisticated and theoretically sound, could not foresee the crisis brewing in financial markets and its impact on the global economy. This emphasises the importance of direct interaction with market participants in gathering intelligence on timely developments taking place in an economy for evidence based decision making.
In this regard, business surveys which mainly focus on capturing the perception of business community play a key role by providing a timely set of information which helps understand the current developments and the future direction of an economy thereby making an opportunity to take pre-emptive policy measures. Among these business surveys, Business Outlook Survey (BOS) and Purchasing Managers’ Index (PMI) Survey are widely used in all over the world to ascertain movements in economic activities. One of the major advantages of these surveys is that the data so collected are not subject to revisions as such surveys generate real time vintage data, which help reduce uncertainty and increase the reliability of forecasts. Having recognised the importance of real time information as an economic policy maker, the Central Bank of Sri Lanka (CBSL) has initiated a BOS in mid-2014 and PMI Surveys covering manufacturing and services activities since May 2015.
Currently, the CBSL is gradually transitioning to a flexible inflation targeting framework. In this context, these surveys are highly useful as such surveys provide information on the current developments and future expectations of economic agents, which are useful in deciding the policy measures required to be taken to align market expectations and to support the economy to move towards its potential level. On the other hand, forward looking information is helpful for market participants to rationalise their expectations on future market developments and to foresee the possible direction of the policies that the policy makers are likely to take in order to mitigate any adverse impact of such developments. In other words, these surveys help anchor market expectations, which is one of the key requirements in a flexible inflation targeting framework. Enhancing the transparency of the CBSL, the aggregate results of these surveys are published in the CBSL website in the form of regular press releases and as a series of data so that the economic stakeholders can utilise such information in decision making.
Business Outlook Survey (BOS)
BOS works as a barometer of an economy providing a snapshot of the business sentiment regarding the existing and expected developments related to key indicators such as demand, sales, prices, investments, production, employment, capacity utilisation and credit conditions. The survey gathers qualitative information related to these key indicators. For example, in order to capture the behaviour of demand, the respondents are requested to mention whether the demand increased, decreased or remained unchanged during a particular period of concern compared to a specified prior period.
BOS as a leading indicator
BOS has been used in many countries to gather market intelligence on economic developments to be considered in proactive decision making process. Countries such as Canada, Switzerland and the USA conduct BOS surveys to mitigate uncertainty on the economic outlook, which is a key concern in forward looking decision making. Especially, Central Banks or Monetary Authorities of these countries pay much attention to the information gathered through these surveys as they provide insights into current and expected developments which could exert pressure on inflation.
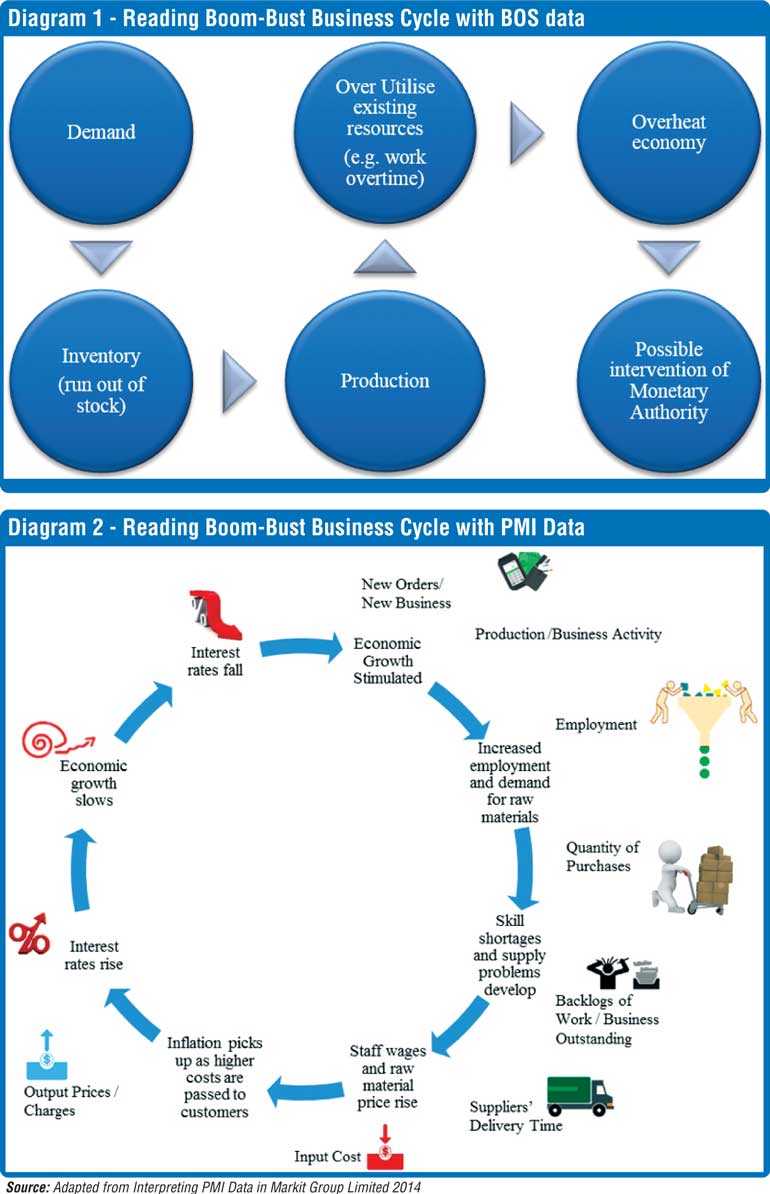
The intuition of these survey findings is important in understanding the underlying developments of the economy. The information gathered on demand, inventory level, sales, production, capacity utilisation, labour availability and investments indicates production constraints as well as the pressure arising from output gap. As explained in diagram 1, if the demand is increasing continuously while inventories are running out so fast, thus requiring firms to increase production by over utilising the capacity and increasing investments, it indicates that the economy is overheating and operating above the potential level and vice versa. If this overheating situation persists for a long period, it signals the possibility of emerging demand pull inflation requiring the intervention of the monetary authority. Further, the information collected on credit conditions and borrowing decisions helps understand the credit market developments in monetary policy decision making and allows policy makers to monitor the gradual pass-through of such policy actions to the economy. Overall, the information collected from BOS signals the turning points of business cycles and underlying reasons, and provides early warnings which are not easily captured through conservative statistics.
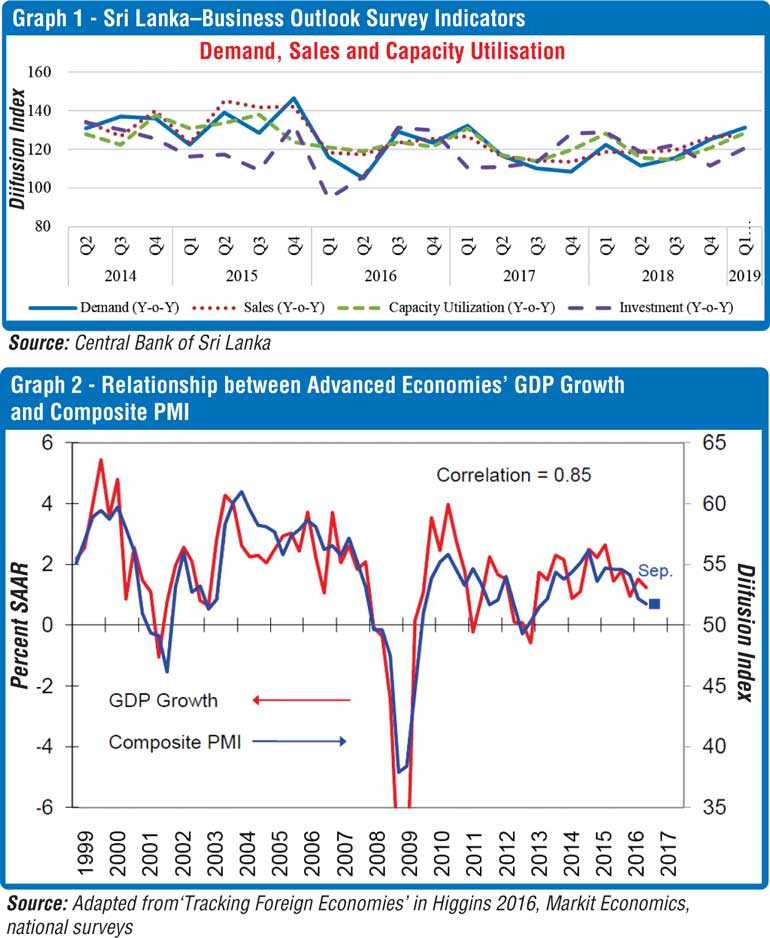
Considering the BOS survey results in Sri Lanka from Q2- 2014to Q4- 2018, balance of opinion related to demand, sales, investments and capacity utilisation are shown in graph 1. The movements in indices seem highly correlated. However, a detailed analysis could be conducted only after a reasonably lengthy series of data becomes available.
Purchasing Managers’ Index Survey
PMI surveys are considered as a high frequency and timely indicators of economic activities. Business decision makers and policy makers are keen on PMI data since the results prove to be useful in economic forecasting, monetary policy decision making and financial market analyses. PMI surveys are generally designed to cover the manufacturing, services and construction activities. PMI manufacturing survey gathers information on new orders, production, employment, suppliers’ delivery time, and stock of purchases, while PMI services survey captures new business, business activity, employment, backlog of work and expectations for activity, on a monthly basis. Similar to BOS, PMI also gathers qualitative information, where the participants are requested to rank whether the business conditions captured by the relevant variables have improved, deteriorated or remained unchanged when compared to the previous month.
PMI as a leading indicator
PMI surveys are well recognised all over the world in capturing the movement of macroeconomics variables such as GDP growth, industrial production, employment, prices, etc. Accordingly, PMI indicators help explain the boom- bust business cycle of an economy as shown in the diagram 2. Therefore, PMI surveys are accredited as a highly useful guide for economic, monetary and business decision making.
As illustrated in diagram 2, with regard to the manufacturing PMI, production and new orders indices (with regard to services PMI, business activity and new business indices) indicate the direction of supply and demand, respectively. If the new orders received by manufacturers and new businesses received by services providers increase, it implies that the demand is increasing. On the other hand, production and business activity indices show the supply side reaction to the demand. If the new orders/new business activities increase while the production /business activities decline, it signals the possible price pressure. When economic activities increase, the demand for labour also rises, which in turn could increase employment. At the same time, if firms intend to increase stocks they purchase, it implies their expectation for increase in demand in near future. Further, parallel to increase in new orders/ new activities, if the suppliers delivery time related to manufacturing activities and the backlog of work of the services activities have also lengthened or increased, in general, it implies that the raw material suppliers and services suppliers are busy in response to the increasing demand. This also implies that the economy is booming, thereby signalling a possible price pressure related to both raw material and output, due to higher demand. In such a situation, the economy might overheat creating an inflationary pressure, which is a key concern in policy decision making.
PMI is proved to be a valuable leading indicator, which reflects the economic developments and policy directions of Central Banks or Monetary Authorities. Markit Group, which compiles PMI for over 30 countries, reveals that the PMI data co- moves with GDP data in both advanced and emerging market economies. According to the Market Group analyses, in advance economies, the correlations between GDP data (Seasonally Adjusted Annual Rates –SAAR) and composite PMI for the period of 1999-2016 is 85 per cent as shown in graphs 2while that for Emerging Market Economies (EME) is 88 per cent for the period of 2006-2016.
Further, as per the international experience, the PMI movement also can be used as a guide for monetary policy decision making and anchoring market expectations. Especially, European Central Bank (ECB), Bank of England (BoE) and Federal Reserve Bank data reveal that the PMI is useful in predicting the monetary policy direction. In Eurozone, the change in ECB’s main policy rate shows a co-movement with PMI. Further, in BoE, PMI All Sector Output Index and the monthly change in BoE base rate witness a higher correlation. Koenig (2002) using the USA data from 1950 to 2002 has done a study on PMI to ascertain its usefulness as a leading indicator of the economic performance and a predictor of Federal Reserve policy direction. The study reveals that manufacturing PMI values above 47 generally signal an expansion in manufacturing activities while increase in PMI values over 52.5 is generally associated with an increase in short-term interest rates in the USA.
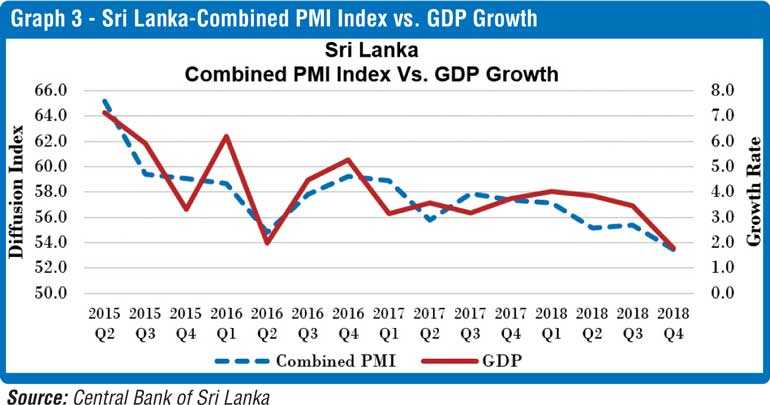
With regard to Sri Lanka, the relationship between the composite PMI, a combination of services and manufacturing PMIs, and GDP growth is shown in graph 3 based on the available data fromQ2-2015.However, the PMI series is not long enough to do a detailed analysis with regard to the correlation between the two series.
In conclusion, business surveys help tracking the health of the economy and the likely direction of the monetary policy. Among such business surveys, both PMI and BOS are proved to be useful indicators, which contribute to the robustness of policy making process. Economic, financial and business stakeholders have recognised these surveys as valuable tools in evidence based decision making. The outcome of these surveys has been compared over the period with conventional statistics to further ascertain its usefulness in policy making process all over the world. Accordingly, when a lengthy series of data is established, the BOS and PMI surveys compiled by CBSL could be widely used in the economic, financial and business analyses and decision making process.
The writer is a Deputy Director attached to the Statistics Department of the Central Bank of Sri Lanka.
References
Higgins, M 2016, ‘Tracking Foreign Economies’, presentation slides of the programme on U.S. Economy: Interpreting the Indicators, Federal Reserve Bank of New York, USA, 11-13 October, 2016.
Koenig, Evan F 2002, ‘Using the Purchasing Managers’ Index to Assess the Economy’s Strength and the Likely Direction of Monetary Policy’, Federal Reserve Bank of Dallas Economic and Financial Policy Review, Vol.1, No.6,
Markit Group Limited 2014, ‘Interpreting PMI Survey Data –Exploring the inter-relationships of selected economic indexes from the PMI surveys’, viewed 10 February, 2016,


