Saturday Jul 18, 2026
Saturday Jul 18, 2026
Wednesday, 2 January 2019 00:00 - - {{hitsCtrl.values.hits}}
On 4 December, German Watch published its Climate Risk Index (CRI) listing for 2019, based on data collected for year 2017 at Munich Re, the reinsurer. Out of 182 countries considered, we, Sri Lanka, who jumped 94 slots from 98th in listing based on 2015 data, to be fourth as per 2016 data had climbed two more slots to be 2nd as per 2017 data. 
There remained only one country worse than us, Puerto Rico, a 9,000 km2 islet in Gulf of Mexico which almost lost all its infrastructure due to devastating thrust of cyclone Maria in September 2017. And what follows is 750km2 Dominica with 75,000 population – obviously, not very fashionable company to keep.
If one needs any motivation to mitigate climate change in Sri Lankan context, these pronouncements for 2018 and 2019 should provide that and one needs to ask all those who were saying Sri Lanka does not need to worry about climate change as our per capita Greenhouse Gas emission is negligible compared to global average, even as late as January 2018 – please note CRI listing 2019 is as per 2017 data – as to what went wrong.
First things first
In identifying the way forward, first thing we did was to understand the reasoning behind listing. Listing is based on score of each country on (a) number of fatalities due to climate disasters in the year, (b) ratio this bears to country’s population, (c) loss to country’s economy in terms of purchasing power parity in dollars and (d) ratio this bears to country’s GDP for the year. While each of (a) and (c) will contribute to 1/6th of total score, each of ratios (b) and (d) will contribute 1/3rd to the score.
These weightage factors seem to be adjusting for high GDP values of developed countries as well as for higher populations of less developed countries. On the other hand, what we should try to do in a context like this is to see how we could make use of the rating and make Sri Lanka, a less vulnerable country.
Second and third steps
Then, we wanted to identify possible factors which could contribute to climate vulnerability. Our research done on climate change and its effects on Sri Lanka prompted us to divide them into two categories: (a) natural and (b) manmade. Natural factors considered were (i) latitude and longitude coordinates, (ii) large-scale circulations modelled by Hadley and Walkers Circulations, (iii) direction country is facing if not a landlocked country, and (iv) area of country.
Then we looked at man-made characteristics. This was divided into two; (i) changes we do to atmosphere and (ii) changes we do to landscape. Changes we bring about in atmosphere is due to emission of carbon dioxide, newly formed water vapour, and waste energy; all three we emit in significant quantities due to combustion of oil and gas.
From climate vulnerability point of view the impact will depend not on per capita emissions, but per unit area emissions. There are no computers in atmosphere and connected to cemeteries and maternity homes to compute per capita values. Changes we do to landscape are of three types; (a) grow another crop, probably agricultural, (b) put up buildings and (c) put up roadways. These influence climate characteristics differently depending on (i) reflectivity (albedo) of new plant type or surface, (ii) ability to absorb carbon dioxide from atmosphere and (iii) extent to which crop could convert Solar Energy into chemical energy.
We will use these characteristics in understanding, explaining and forecasting climate vulnerability for the future, and to move down in CRI listing.
Some comments by CRI listing authors
CRI listing authors made some interesting comments which are better kept in mind for future. One comment is listing not be considered as a comprehensive vulnerability scoring. It also mentioned that being listed in top 10-20 countries listing should be considered as a warning and corresponding country should take action to prevent itself moving into top of list in subsequent years; but we have not been able to do that. So, we need to take immediate action to prevent ourselves being the most vulnerable country next year.
Another important thing is that out of 18 countries in 2018 and 2019 listings, there was not a single country which had not been beaten by a water-related disaster while only three countries have been affected by droughts.
Significance of different parameters
Now we can look at how the parameters we identified contribute to devastation. First, we will look at how manmade aspects contribute to different disasters and then we will identify how natural characteristics prevent other countries being affected by same anthropogenic activities. We will first look at changes to atmosphere we have brought about by anthropogenic emissions.
In order to do comparisons, we calculated the emissions per unit area and one might wonder whether Greenhouse Gases (GHG) emitted would remain within a silo above Sri Lankan landscape. This is where larger air circulation models help in understanding the issue. Latitudinal circulation depicted by Hadley Circulation, indicates air flow moving upwards and northwards will drop moisture and come back and there would not be much carbon dioxide dispersion in that direction.
Around March and April, there may be rainfall in South India and CO2 in vegetation increases (there are research papers on this) and CO2 level here may come down and there could be precipitation in May in Sri Lanka. If one looks at longitudinal circulation as depicted by Walker Circulation, one sees that longitudinal circulation is almost zero and as such we would say that what we emit would practically remain above the landscape to a much larger degree than elsewhere.
If you look at USA and India, again, emissions would fall back on its own landscape in longitudinal direction and countries at 18 to 20 degrees South latitudinal coordinates would also see a similar phenomenon. As such, in this comparison we have used emissions of GHG per unit area basis. Although we have considered CO2 as a characteristic to reckon, we strongly believe that NFW is more harmful; because it can precipitate. When it is in atmosphere, it brings about unbearable Greenhouse Gas effect; when it is coming down, it leads to cyclones, hurricanes, etc., and when on ground it leads to flooding, landslides, etc. So, one sees that it exercises an unimaginable thrust upon mankind and notes which German Watch has provided in the CRI 2018 and 2019 documents are enough testimony to the same.
I believe statements such as “precipitation is destructive,” “water cycle intensifies,” “there is a relationship between temperature and record rainfall,” “sea surface temperature goes up leading to storms,” etc., could all be considered as manifestations of significance of water vapour.
For about the last 25 years, we were considering only carbon dioxide as climate enemy and were willing to bring in other fuels, like gas, to reduce carbon dioxide contribution from fossil fuel combustion. This confusion has been so widespread and deceptive, we have 15 out of 18 countries in CRI 2018 and 2019 listings been in listings due to water related disasters. And according to International Energy Agency, they want to proliferate gas even further.
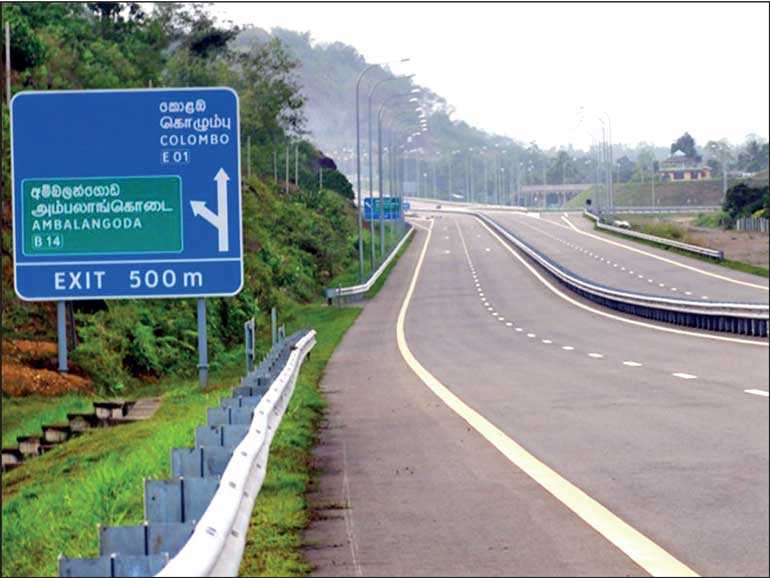
Road density
Next parameter, Road Density, measures the change we had made to land surface. This is worse than other changes to land use like agriculture or putting up buildings. Asphaltic roadways absorb nearly 90% of solar radiation and could lead to global warming. When there are too many roadways, there will be too many vehicles plying on these roads emitting CO2, NFW and waste heat.
Comparison table
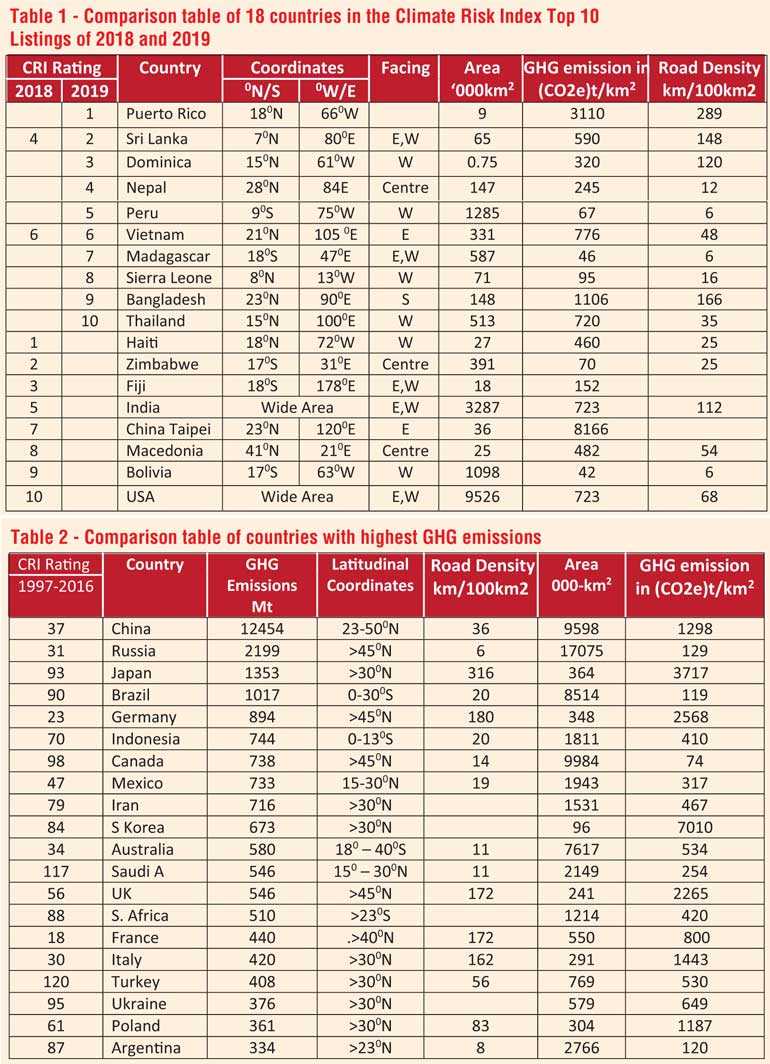
We prepared Table 1 for all 18 countries in CRI lists of top 10 countries in 2018 and 2019; two countries Sri Lanka, Vietnam were common to both. Now we will try to explain inclusion of these countries in this listing.
a) Puerto Rico and Dominica are in listing due to their positions in Gulf of Mexico, been subjected to very forceful hurricanes and these have only increased in intensity during last few years. Puerto Rico has highest road density and second highest GHG emission value out of 18 countries. They have to face onslaught brought about due to
Hadley Circulation.
b) Sri Lanka has a high road density and GHG per unit area. It is also closest to equator at 70N.
c) Nepal at 230N receives lot of rain from south due to Hadley Circulation.
d) Peru is third closest to equator and uses natural gas as fuel.
e) Vietnam is facing east and vulnerable to Pacific Ocean’s typhoons, etc. At 140N and emitting 776 t/km2 of carbon dioxide, it attracts these cyclones, etc.
f) Madagascar is a small island with relatively high GHG emission level. It is one of four countries in 170 to 190 South range which is affected by Hadley Circulation.
g) Sierra Leone is a West facing small country close to equator at 80N.
h) Bangladesh is receiving lot of precipitation due to Hadley circulation, combusting a lot of gas. It emits third highest GHG quantity and has second highest road density after Puerto Rico.
i) Thailand combusts lot of gas and emits 720 t/km2 of GHG and being struck by hurricanes.
j) Haiti is a small country at 180N emitting 460 t/km2 of GHG and being struck by hurricanes in Mexican Gulf area.
k) Zimbabwe is a country in 170 to 190 South range.
l) Fiji is a group of small Islands in 170 to 190 South range emitting 152 t/km2 of GHG.
m) India is fifth highest GHG emitter with a high road density. It receives CO2 and NFW emitted within its own territory and Sri Lanka as per Hadley Circulation and low Walkers longitudinal circulation. The area is almost under 300n latitude and also consumes a lot of gas. It has a front onto the east and as a result gets struck by cyclones, etc.
n) China Taipei is the country emitting the highest GHG per unit area in the world at 8166t/km2 and facing East. It uses a lot of natural gas and receives a lot of rain; but it is at 230N.
o) Macedonia is one of two countries beyond 30°N. It’s the ninth highest GHG emitter.
p) Bolivia is in 170 to 190 degrees South region.
q) Although we consider USA as one country what is affected are Texas, Florida and Louisiana on East Coast and California on West Coast. Each of these situated south of 300N line would have been in list on their own right if not categorised as USA. These four states in southern rim receive the heat from equatorial ocean and those along the Eastern border get enough and more emissions from oil refineries in Gulf area. If all NFW emitted within USA move towards Southeastern Boarder of USA as per Walker Circulation one should not be surprised by these calamities. This large country, USA with a 9,226,000km2 area emits 723 tons of CO2e /km2. I have previously written on how NFW from vehicles on roadways in USA – Texas and California has very high lane miles of roadways per 100 km2 – increase speed of cyclones entering USA.
Why aren’t these countries vulnerable?
Looking at these parameters and values mentioned in Table 1, one may wonder why those other countries with larger GHG emission values are not in most vulnerable country list. In order to understand this, we prepared Table 2 with top 20 GHG emitters (excluding those already captured in Table 1) and related data. I have also indicated their listed rating based on 1997-2016 data.
We calculated GHG emissions per unit area and noted road density values. When one looks at these countries, one could see that either they are further away from the equator than 300 N/ S, or their per unit area emissions and / or road densities are low. In the two cases of China and Japan, their absolute losses may be significant, but when adjusted for their GDP values and/or populations resulting figures become less significant.
As could be seen from above Table 2, there is not a single country with a higher GHG emission value nor a higher road density than those of Sri Lanka and closer to the equator than 300N in this table. So, one could see that the latitudinal coordinate is one single prerequisite which determines whether a country with significant emissions and road density values would be vulnerable or not.
Why this 30° North the cut-off point?
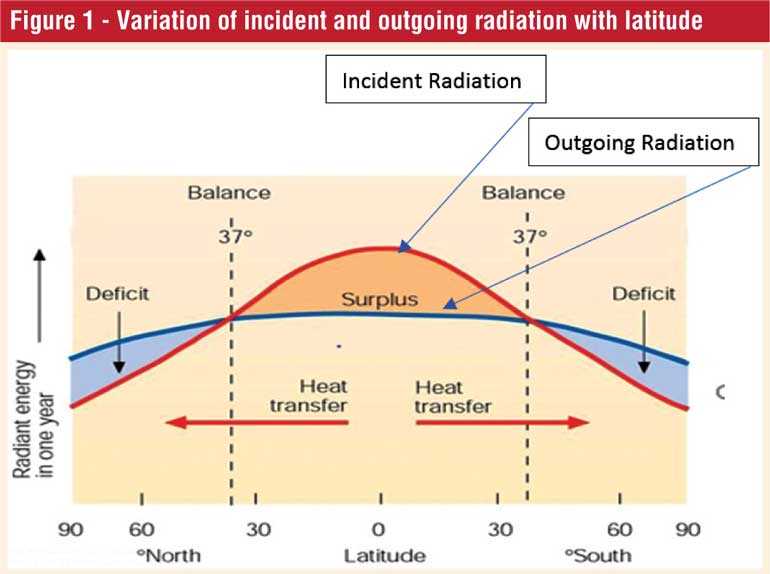
The significance of this 370N latitude can be understood by looking at Figure I taken from the internet.
According to this, Earth receives far more radiation near to zero latitude than the outgoing and it is at 370N/S that these two quantities are equal. Unlike vegetation or desert loom, ocean waters close to the equator absorbs solar radiation more which is transmitted by oceanic water to the polar regions from where it is emitted out. At Sri Lanka’s longitudinal coordinate of 800E, there is no northward oceanic circulation to take this incident heat to the North like along Atlantic and Pacific oceans.
Furthermore, closer to the equator, there is more outgoing long-wave radiation and as such the amount of global warming due to GHGs in the atmosphere will also be more. So, (a) solar radiation absorbed by a unit area of roadway, (b) amount of IR radiation emitted by the roadway and (c) the same reflected by a given amount of GHGs in the atmosphere would all be much higher closer to the equator than from a similar roadway area but away from the equator.
What takes a country to CRI listing Top 10?
It could be seen that vulnerability of a country to climate change related disasters stems from the following four characteristics. (a) Geographic location of the country with latitudinal and longitudinal coordinates, (b) Large scale atmospheric circulation as depicted by Hadley and Walker circulation models, (c) GHG emissions per unit area of the country, (d) Road density of the country. Combination of these four characteristics will make a country less or more vulnerable to climate change related risks.
What can be done to take us away from the top?
When one looks at the four key factors which has thrown us, Sri Lanka, to second position in CRI list, we cannot influence the first two factors, our latitudinal and longitudinal coordinates and atmospheric circulations. As such, we need to work out our escape along the other two criteria. These are our GHG emission per unit area and the road density.
The best option for reducing GHG emissions will be to move away from oil fired transportation to vehicle electrification. This is so because it is through transportation that we can eliminate highest amount of GHG emissions per one unit of energy obtained from another source. This is due to the lowest efficiency of internal combustion engine powered vehicles at 18 to 22 percentage.
The second aspect we could address will be the high road density in Sri Lanka. Actually, it is not an issue with the high road density alone, but it is the combination of this blackish road surface and the high solar intensity that impinges on it. So, one solution we could think of will be to put up something in between so that this impingement does not take place and what could be better than a PV solar panel there and to generate electricity as well. And if you use electricity generated to power a battery electric vehicle one could save the quantity of waste energy that would be generated by the ICC powered vehicle which would be about four times the energy supplied by the panel.
Conclusion
So, one and only way to prevent Sri Lanka being the most vulnerable country to climate risk will be to move away from petroleum-driven transportation towards vehicle electrification and implement highway solarisation on as many highways as possible and thereby reduce our GHG emissions per unit area and nullify the absorption of solar radiation by the many highways we are building.
If someone has a better solution than this, then that someone should come out with that better solution today, when we are number 2 in the CRI listing rather than wait until we come to be number one country in the list, and then say this is what we should have done.
(The writer is Managing Director, Somaratna Consultants Ltd.)

