Thursday Mar 19, 2026
Thursday Mar 19, 2026
Tuesday, 11 September 2018 00:00 - - {{hitsCtrl.values.hits}}
There is absolutely no time for different fuels as suggested by Prof. Ajith de Alwis in his article titled ‘It’s time for different fuels; equations are only equations’. We are at No. 4 slot in German Watch’s Climate Risk Index listing, having jumped 94 positions since previous ratings.
Thursday, 23 August, was a very bad day for me; at least I thought so. Early in the morning I read the above mentioned article implying that we need to restart on our journey towards alternative fuels; more about it later. Then in the evening at the inauguration of Association of Disaster Risk Management Professionals, I heard Ranga Bandara, the State Minister for Irrigation, Water Resources and Disaster Management mentioning that Sri Lanka has moved from 98th position in German Watch’s Climate Risk Index listing in 2015 to the 4th position behind Haiti, Zimbabwe and Fiji Island in 2018 listing.
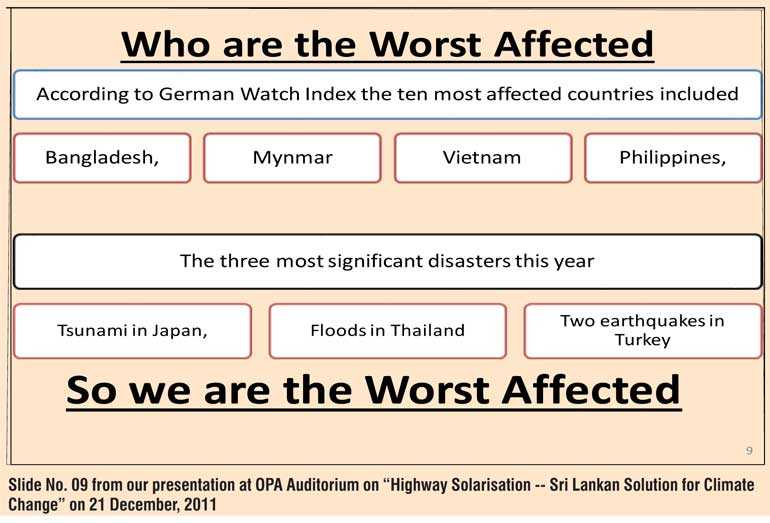
My mind went about 350 weeks on reverse gear to the evening of Wednesday, 21 December 2011, when I made my first public presentation on ‘Highway Solarisation – Sri Lankan Solution for Climate Change’ at the OPA Auditorium and presented slide No. 09 shown on this page. When I said that (a) four Asian countries Bangladesh, Myanmar, Philippines and Vietnam are in German Watch’s CRI Listing of 10 most vulnerable countries, and (b) we, Asians – occupying four slots out of the 10 – are the worst affected, I never imagined that Sri Lanka would be fourth ahead of all those four countries, only seven years thereafter; more so after our presenting the only Universal Mitigation Solution for Climate Change in the world. The pain of mind, this new situation brings me is enormous.
Such has been the success with which climate scientists – both local and foreign – have deceived the political leadership of this small 65,000km2 island state, we had managed to jump 94 positions in the listing in just a couple of years with (i) our negligible per capita greenhouse gas emissions, as per climate scientists and (ii) the President looking after the environment. Let us not waste time on that since I wrote about it only a few weeks back.
Equations are only equations
This is not the first time I have heard that “Equations are only equations” to be taught and learnt in universities and to be included in answer scripts. I believe it is the same meaning that people – corporate higher-ups – imply when they say that “it is only theory and they don’t work in the actual day to day world of corporate dynamics”.
In the 1978-1980 period I, as the System Analyst of State Pharmaceutical Corporation, was hearing this every week or at least every fortnight. When my Chairperson, late Dr. L.G. Jayawardena, sister-in-law of the then President, summons me to her room in an early morning, I know that she had found a key drug unavailable at the main stores. When in the ensuing conversation, I explained that the item is available in the pipeline consisting of stockists and pharmacies, Senaka Jayawickrema, the General Manager, would always say that I am a theoretician and my theories would not work in the practical world of business. I would explain that if my theory fails me in actual practice, I would rather amend the theory to accommodate the deviation – if any – but not dump the theory in the dust bin.
Dr. Jayawardena, with a Ph.D. in Medicine, readily agreed with me and the outcome was the corporation’s stock holding decreased from $7 million to $ 4 million with no increase in the stock-out situation and the corporation survived the 1977 regime change for the current Government to reduce prices of 48 essential drugs – we had 64 essential items then. So, my equations for Economic Order Quantities, Reorder Levels, and Weighted Moving Averages has served the Sri Lankan patients in the long run very well.
On 20 August, Daily FT carried an article of mine (www.ft.lk/columns/Climate-scientists-cheating-us-to-a---12-b-year-economic-loss-in-2050/4-661185) and opposite page carried an article to show how Sri Lankan exports benefitted from GSP+ granted by EU. It contained a list of 23 items which had brought $ 3,422 million in 2017 and two items in list were Coco Peat ($ 35.8 million revenue) and Activated Carbon ($17.4 million revenue) - both values were only from EU countries. When I read that article by Prof. Alwis, I remembered how readily late Rajan Yatawara (RY) respected all our computations using equations and few such instances were related to these two products.
It was in 1988, that I put a small 8”x5” beige coloured paper to RY with calculations for (a) solar radiation falling in a day on 5000m2 coir dust heap at Wijeratna’s fibre mill at Madampe and (b) amount of energy that would be required to reduce moisture in a 25mm layer of coir dust on that heap from 90% moisture content to 20% moisture (both on wet basis) and suggested that we get five or six people to rake a layer of about 25mm on top of the heap in the morning and keep on turning that layer during the day and collect same in the evening. That is how we achieved the feat of drying this coir dust to 20% moisture, which feat corporate giants like Ceylon Tobacco, Ceylon Electricity Board, IDB, etc. failed to achieve during the previous five to 10 years.
Then we used equations to calculate the electrical conductivity, porosity, etc. of the dried coir dust. It was thereafter that I proposed price of Rs. 21 per kilo (price of sugar at that time) for coir dust briquettes – those corporate giants were planning to use the compressed material instead of firewood available at Rs. 1.50/kg. If I did pricing based on cost + margin strategy instead of this demand-based pricing, the industry would have collapsed a few years ago. Are you surprised that we respect the equations which enabled us to do these calculations?
In respect of activated carbon too, I applied many equations to design the zigzag separator which removed the soft particles in the activated carbon for the gold recovery market to retain that market and this was described in a previous article in Daily FT (www.ft.lk/columns/From-innovate-or-perish-in-1998-to-innovate-and-perish-in-2018/4-653157).
In calculating numerical values in my article which appeared on 20 August corresponding to solar energy falling on the 96 kmx22m stretch before and after highway construction and also after Highway Solarisation, again I used similar equations and I am very confident that the final outcome will be equally beneficial for the country, and much more significant as well. It is this same disrespect for equations which made a chemical engineering department in a university spend resources researching on converting waste polythene into an automobile fuel.
The search for different fuels
When we started our work on a solution for climate change, we studied what was already available in literature and one of the first references we used was IPCC’s Technical Assessment Report No. 4 – document which won 50% of Nobel Peace Prize. Unfortunately, that report did not have the name of a single Sri Lankan who had contributed to it, either directly or indirectly. We read the volume from beginning to end and learnt that looking for an alternative for transportation meant looking for two components – a fuel and a vehicle to use with that fuel. It is after reading all these that we understood the intricacies of identifying an alternative transport fuel road map.
During the last 10 years, we have studied these in great detail, reading almost everything available and even at the presentation we made at OPA in 2011 we indicated the options available for both the fuels and corresponding vehicles in our slide no. 29. In the least, Prof. Alwis should read ‘Transport Technologies and Policy Scenarios to 2050’ by World Energy Council – 2007 to understand how different fuel – vehicle combinations compare with each other. This study has evaluated the different options consisting of alternative vehicles and energisers using a framework with three key characteristics Availability, Accessibility and Acceptability and concluded Battery Electric Vehicle (BEV) and Hydrogen Fuel Cell Vehicle (HFCV) to be the winners; but even to achieve 5% transition by 2050 (from 2007) through HFCVs we needed to invest $7 trillion while that amount of funding would achieved more than 60% conversion using BEVs with Highway Solarisation.
It was after studying all these, we announced in February 2011 in a newspaper article that out of all the options considered by these entities up to then, vehicle electrification with highway solarisation is the best solution available. In July, 2011 Prof. Henry Lee of Harvard Kennedy School announced that Battery Electric Vehicle is the winner after working with a mathematical model. He only identified the winner in the vehicle race and not the winner in the energiser race.
Even UNFCCC itself has passed judgment over this when they announced three objectives for transportation road map in September, 2014 in (a) by 2030, 30% of new vehicle sales in cities should be BEVs, (b) they should be powered by renewable energy and (C) deforestation should be reduced to 50% by 2030 and to 0% by 2050. This is similar to BEVs with highway solarisation, we believe.
It is true that our own Sustainable Energy Authority was working on road maps for different fuels in the past. When Secretary to the Ministry of Environment summoned a meeting of senior personnel of different entities related to highway solarisation in 2011, the Sustainable Energy Authority was represented by Harsha Wickremasinghe, Deputy Director General.
When the Environment Secretary asked Wickremasinghe for his comments on highway solarisation, Wickremasinghe said that he had studied highway solarisation for about three months – I had made a presentation to him and two other engineers at SEA a few months earlier and shared the presentation with them – but he could not find a single zero extra nor missing. It may be after that, probably, they stopped work on alternative fuels. In my presentation I had spoken about different fuel – vehicle combinations and shown that they would yield only much inferior results.
Comparison in brief
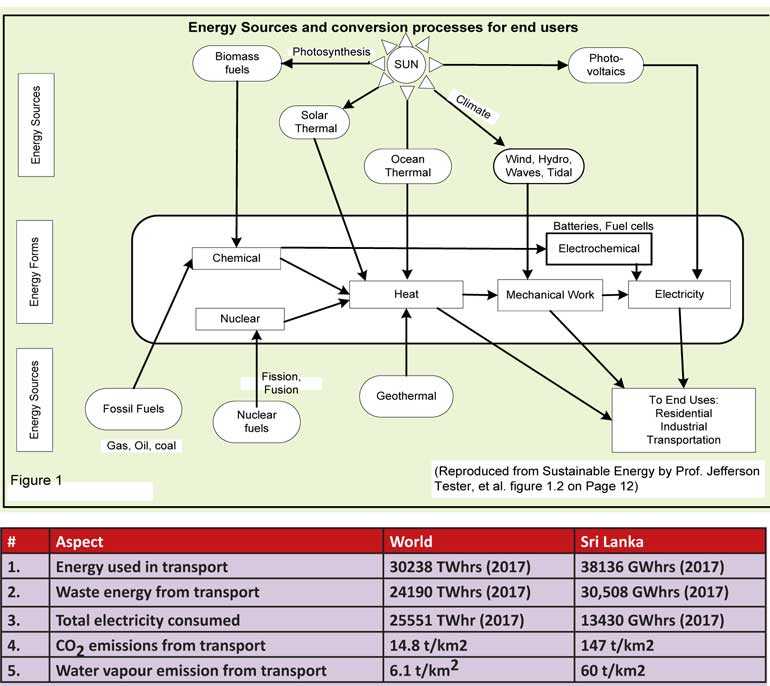
In fact it is very easy to do a quick comparison between alternative fuels and highway solarisation. Any alternative Prof. Alwis can think of need to be in the following diagram given as Fig 1.2 in ‘Sustainable Energy’ by Prof. Jefferson Tester, et al.
Prof. Alwis talks about different alternative modes of transport – bus to rail, etc. – and also about the mode of energising the same – bio-diesel, alcohol, algae, cellulose, etc. From this figure, one could see that all these energiser forms do emanate from the sun, our source for all types of energy.
The amount of processes and services you would be using to get your vehicle energised could be gauged by the route you will utilise to obtain the energy for the box at the bottom right hand corner from the common origin sun. The route you select will have a few characteristics which will determine the efficiency and the lead time of the route as follows: (a) number of steps involved, (b) efficiencies of the routes taken – please note that none of the intermediate steps are 100% efficient, (c) other consumables, (d) energy required for the particular step, (d) how the outputs from the process will influence the ecosystem itself, etc.
Rolled Throughput Yield (in Six Sigma methodology jargon) of a combination of a few processes in series is equal to product of Throughput Yields of individual processes and if throughput yields of individual processes are less than 1, the RTY will only decrease as one increases number of processes involved. It is worthwhile to notice that almost all fuel options which Prof. Alwis talks about starts with photosynthesis (see figure 1 shown) which has an efficiency of only about 8% in respect of conversion of incident solar energy to chemical energy. It is not only the yield that suffers when number of processes increase; each process also has a finite time to bring about conversion. If you look at bio fuels, e.g. alcohol, it also needs a significant time to capture a sizeable chunk of solar energy to make subsequent conversion to energy using a lot of equipment a worthwhile exercise.
While highway solarisation (photovoltaics with electricity route) will energise the vehicle on the highway using the energy coming from the sun within hours or minutes or even seconds, and the overall efficiency will be more than 15%, others would need at least months or sometimes years to bring that energy from the sun to turn the wheel of the vehicle. Similar ratios would be applicable to any of the other parameters as well.
Sometimes, one may be intrigued as to how energising that End User Box through a few boxes on to the right and below could be cheaper than energising it straight through photovoltaics and electricity. The secret lies in the fact that some of the ecosystem services you have used in that long process have neither been compensated in cash nor kind and that cost will undoubtedly accrue and somebody will have to pay for it in the future most probably by undergoing unbearable hardships. There is absolutely no escape from this certainty. The value of these ecosystem services available is estimated to decrease by $4.3 to 20.2 trillion (2007 dollars) per year depending on whether (1) only unit value changes are considered or (2) changes to both unit values and biome areas were considered.
What can we do about our CRI rating?
I believe that there is an urgent need to address this CRI Rating and ensure that we do not move any further up – towards No. 1 rating – but move down as much as possible. In order to do that we need to understand why we moved up 94 slots in a couple of years. We obviously should have done something which others – at least those Asian countries who were in the top 10 slots in 2011 – have not been doing. Having studied climate change during last 10 years in adequate detail, I am very sure that it is how and to what extent we indulge in transportation using gasoline and diesel. I wish there is somebody – one of the local climate scientists – who could come out with a different approach.
When I wrote on ‘Economics prevailing over politics’ a few weeks back, I mentioned that our expenditure on transportation as given in Table 8 of our CBSL Annual Report – 2017 is more than 70% of what we spent on our food and non-alcoholic beverages. The table indicates how we are faring in respect of a few key indicators which in our opinion, would decide whether we are moving up or down the CRI Listing.
As we had been repeatedly saying, if there is one parameter which makes the biggest contribution to this vulnerability to climate change related risks it is the unbearable usage of motor vehicles in this small country. An analysis of our energy consumption in the transport sector as indicated below in tabular form will throw some light on this. It could be seen that while for the whole world, waste energy from transport is slightly less than the electricity generated, for Sri Lanka waste energy from transport is more than twice the electricity consumed.
Please note that according to classical climate change theory every ton of CO2 entering the atmosphere could bring up another 0.62 t of water vapour to the atmosphere and this 0.62 tons of water vapour could increase the temperature by an amount equal to 1.3 times that due to the original amount of CO2. This is excluding the water vapour emitted along with CO2 as in the case of petrol and diesel. When one considers all this one should not be surprised that we have made this leap over 94 other countries in a couple of years and the next leap would not be much difficult unless this is rectified.
From the above it could be seen that if ever there is a single criterion, which would clearly indicate why we in Sri Lanka should overtake the other four Asian countries which had occupied the top 10 slots in the CRI ratings in the past, then the emissions arising from our transportation in diesel/gasoline powered automobiles is definitely that singe criterion. There may be other criteria and let climate scientists – either local or overseas – indicate them and then we can do the comparisons to work out the way forward to take Sri Lanka lower in the CRI ratings.
Conclusion
With Sri Lanka at No.4 position in German Global Watch Climate Risk Index rating, having jumped 94 positions since the previous ratings, we are in a precarious situation in respect of climate change. Prof. Alwis is planning to reinvent the wheel by doing research – desk or otherwise – to see what alternative fuels could offer over and above vehicle electrification.
While Prof. Alwis appears to be concerned about the import cost of oil, he does not seem to be concerned about the unimaginable harm ever increasing oil imported to power automobiles do to the climate in Sri Lanka via, (a) waste heat generated which is more than double the total electricity consumed, (b) CO2 generated and (c) newly formed water vapour generated. These three are sufficient for the balance leap to happen for Sri Lanka to become the most vulnerable country in the world.
Any worthwhile action plan to prevent this happening need to commence with putting a stop to the increase in oil importation to power the automobiles in Sri Lanka.
(The writer is Managing Director of Somaratna Consultants Ltd.)

