Saturday Jul 04, 2026
Saturday Jul 04, 2026
Saturday, 11 April 2020 00:03 - - {{hitsCtrl.values.hits}}
 The coronavirus has taken the world by surprise. The novel coronavirus SARS-CoV-2 disease has been named ‘COVID-19’ by the World Health Organization (WHO). The WHO has declared the outbreak of the new coronavirus a pandemic as health authorities around the globe continue to scramble to contain the sickness, first detected in the central Chinese city of Wuhan in December last year.
If COVID-19 spreads extensively, containment may not be realistic. Response efforts will likely necessitate lockdown which will impact harshly on the economy and all normal activities of a population. It is, therefore, important to have a range of reliable evidence for decision making to balance the controlling the spread of the virus while making minimum adverse effect on the economy and people’s lives.
This article presents the findings of a quick study of the risk of spreading the COVID-19 across districts in Sri Lanka. It provides a spatial map of the districts classified into five categories according to the risk of spreading of the virus. Its purpose is to serve as a guide to phasing out the strict measures that are in place for the containment of the virus.
Methodology
The methodology used is to compute an index, which is called here the ‘Risk of spreading COVID-19’. The index is computed for each district. The higher the value of the index for a district, more likely that COVID-19 would spread.
The risk of spreading is considered to depend on three factors. The risk is higher in districts with a higher number of infected people, higher population density, and larger proportions of elderly people (over 60 years). The higher the number of people infected, the higher the population density, the higher the elderly population, the higher the index should be.
The measure of the total number of persons infected was taken as the cumulative daily total of confirmed COVID-19 positive persons from 21 March to 7 April. The cumulative total for each day was one variable. Thus, there were 17 variables. These numbers excluded foreigners and persons reported from quarantine centres.
The statistical tool called the Principal Component Analysis (PCA) was used to compute the risk index. The central idea of PCA is to reduce the dimensionality of a data set consisting of a large number of interrelated variables, while retaining as much as possible the variation present in the data set. In other words, to replace a large number of correlated variables with a smaller set of uncorrelated factors called “principal components”. A statistical software package (SPSS) was used to carry out the PCA.
Data
The risk of spreading of the virus depends on the number of infected people. However, data are not available on the total number of persons with COVID-19. What is available is the number of “confirmed cases”. A confirmed case is “a person with laboratory confirmation of COVID-19 infection,” as WHO explains.
The number of confirmed cases is a subset of the total number of persons with COVID-19 infection. In the absence of the total number of COVID-19 persons, the confirmed number with COVID-19 was used as a proxy for the analysis.
The source of data for the confirmed number of cases was the daily situation reports published by the Epidemiology Unit of the Ministry of Health on its website (www.epid.gov.lk) for the period 21 March to 8 April. The population density and percentage of elderly population were taken from the data published by the Department of Census and Statistics.
Analysis
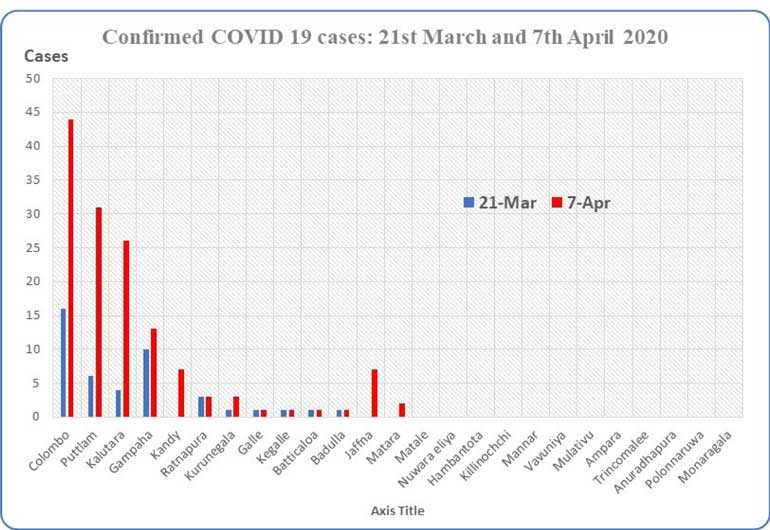
The number of persons confirmed with COVID-19 in each district is seen in the chart. As can be seen no persons were confirmed in 12 districts. In some districts the numbers have remained static over the period under study. In Colombo, Puttalam and Kalutara there has been a rapid increase. In Kandy, Jaffna, and Matara new cases were found during the period.
Only one factor was extracted through PCA and that factor, which is a linear combination of the 17 daily cumulative totals and the population density could explain 90% of the total variation of the data set. Therefore, this component can be considered as a proxy for the risk of spreading COVID- 19. Higher the value of this component, the higher is the risk of spreading. Unexpectedly, the size of the elderly population did not affect the risk.
Mapping the risk of spreading of the CORONA-19
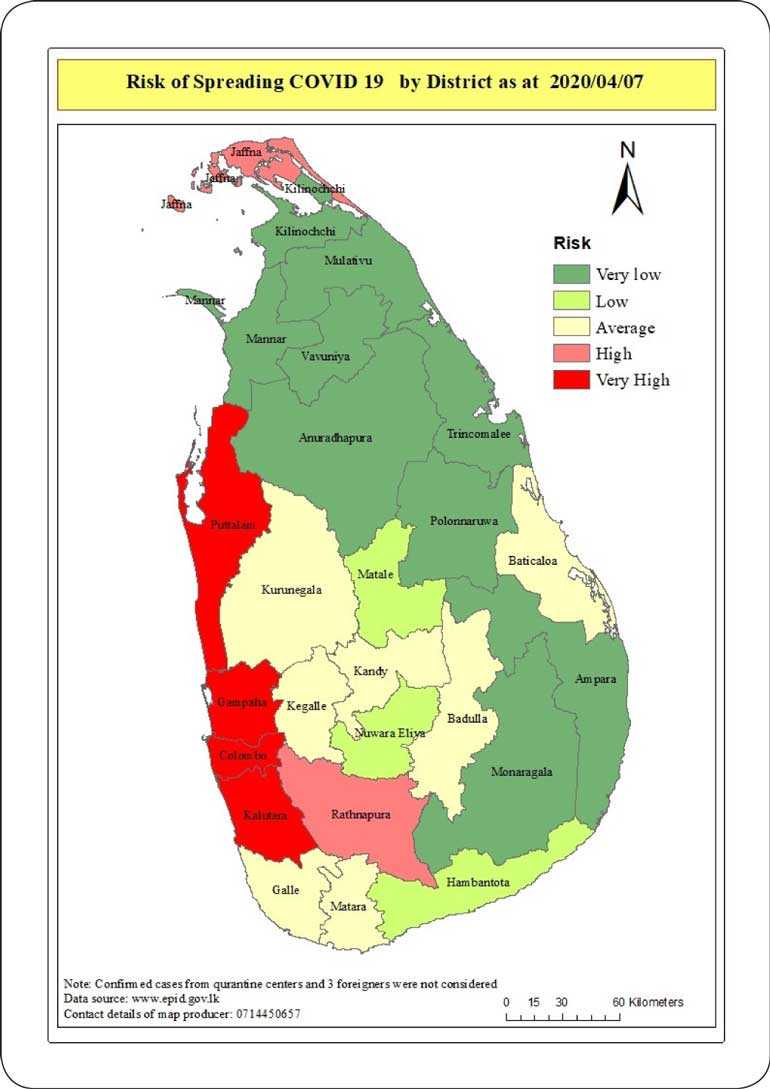
The districts were grouped into five classes according to the risk of spreading within the district. The grouping was done using a statistical method known as natural breaks, which divided districts into groups based on the natural groupings inherent in the data. Class breaks are identified such that similar values were grouped and differences between classes are maximised. Using GIS software, the 25 districts were divided into five classes with respect to the risk of spreading index.
The risk of spreading is labelled as ‘Very High,’ ‘High,’ ‘Average,’ ‘Low’ and ‘Very Low’. As expected, the risk of spreading is very low in those districts (marked in dark green) where no confirmed patients were identified. Risk is very high in Puttalam, Gampaha, Colombo and Kalutara Districts. In these districts a higher number of cases have been reported, and population density is very high in Colombo, Gampaha and Kalutara. Risk is low in Matale, Nuwara Eliya, and Hambantota Districts and no cases have been reported yet. Risk is ‘High’ for Jaffna and Ratnapura Districts. Districts marked in yellow run an average risk.
Implications
The risk map produced in this study can be used as evidence for making decisions on relaxing the containment criteria such as lockdown and relaxing curfew periods within districts.
Relaxing restrictions on the movement of people is a dynamic concept, and decisions should be taken in the best interests of the people and the economy, which is facing serious threats. This map could be used to make decisions, for example, on a phased exit strategy from the curfew.
Restrictions can be partially lifted in low-risk districts (districts shaded in dark green) while continuing with stringent restrictions in high-risk districts (districts shaded in red). This will allow recommencing economic activities in unaffected districts. However, border crossing to unaffected districts should be tightly controlled.
It must be noted that, like any other study, this study has some limitations. We have taken the number of confirmed cases as a proxy to the total number of persons with COVID-19. If the two numbers are approximately proportional, the bias on results would be small.
The other factor to consider is that density is not uniform across any given district. Smaller geographic units such as DS divisions could give more detailed patterns of risk, but this was not practical due to the lack of data at DS division level. Ideally, the findings could be reviewed by data scientists, geographical epidemiologists, other health professionals and policymakers to be adjusted for gaining some overall insights into the pandemic.
Finally, it must be noted that this study was done to gain some insight into the risk of spreading of the COVID-19 within districts. This evidence needs to be considered along with other relevant information to make good evidence-informed decisions on balancing cautions against the spread of COVID-19 and allowing a return to normalcy at optimal speed. The map can be updated as more data becomes available for monitoring and to make dynamic and informed decisions on controlling the spreading of the virus.