Monday Aug 03, 2026
Monday Aug 03, 2026
Thursday, 5 December 2019 00:00 - - {{hitsCtrl.values.hits}}
By Ceylon Tea Brokers Plc
The third quarter of the Sri Lankan tea industry in 2019 saw a decline in elevational averages in comparison to the second quarter.
Increased tea production and export volumes were witnessed in the first three quarters in 2019 in comparison to the same period last year. Macro-economic factors continued to have a severe impact on the Sri Lankan tea industry.
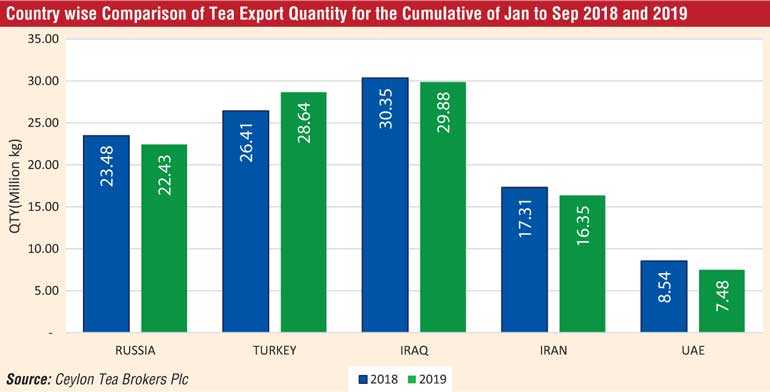
Iraq, Turkey and Russia continued with strong demand for Sri Lankan tea and were the top three importers in the first nine months concluded.
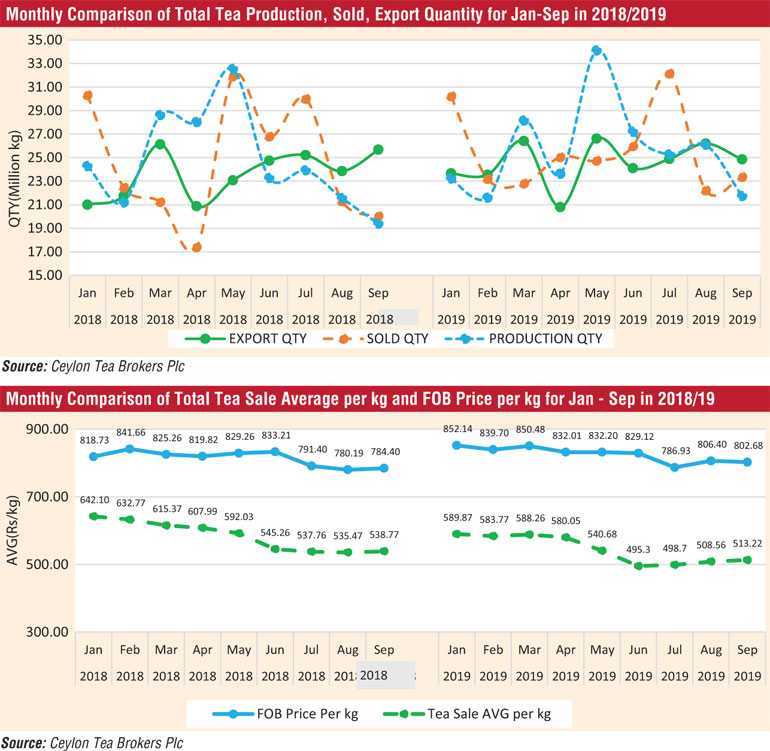
The total Sri Lanka tea production for January-September 2019 recorded 232.75 Mn Kgs in comparison to 223.03 Mn Kgs (+ 9.72Mn Kgs) for the same period last year. Production has increased by 9.72 Mn Kgs and exports have increased by 8.76 Mn Kgs compared to the same period in 2018.
The total national average of the teas sold for the period January to September 2019 was Rs. 541.88 ($3.05) in comparison to Rs.581.95 ($.3.68) for the same period last year. Low Growns averaged Rs.572.97 ($3.22); Mid Growns recorded Rs.468.66 ($2.63) with High Growns at Rs. 506.82 ($2.85).
The averages for High, Medium and Low Growns in Rupee and Dollar terms, shows a decrease for the period January-September 2019 when compared to the same period in year 2018. Low Growns with the largest market share with 63.36% of the production recorded a decrease of (-Rs.28.05) whilst High and Medium Growns recorded a decrease of (-Rs.63.37) and (-Rs.52.96) respectively when compared to the corresponding period in the year 2018.
Sri Lanka tea exports for the period January-September 2019 amounted to 221.10MnKgs vis-à-vis 212.34Mn Kgs recorded for the same period last year (+8.76Mn Kgs). The FOB average price per Kilo for this period stood at Rs.825.49 as against Rs.813.09 recorded for the same period last year. (+Rs.12.40).
The total revenue realised for the period January-September from tea exports was Rs. 182.51 b ($1.03 b) compared with Rs. 172.65 b ($ 1.09 b) recorded last year. It’s an increase in Rupee terms (+Rs. 9.86 b) and a decrease in Dollar value (-US $0.06 b) compared to the year 2018.
Iraq has emerged as the largest buyer of Sri Lankan tea in the period of January-September 2019. Turkey and Russia records as the second and third largest importers of Sri Lankan tea for the mentioned period.
World economic outlook
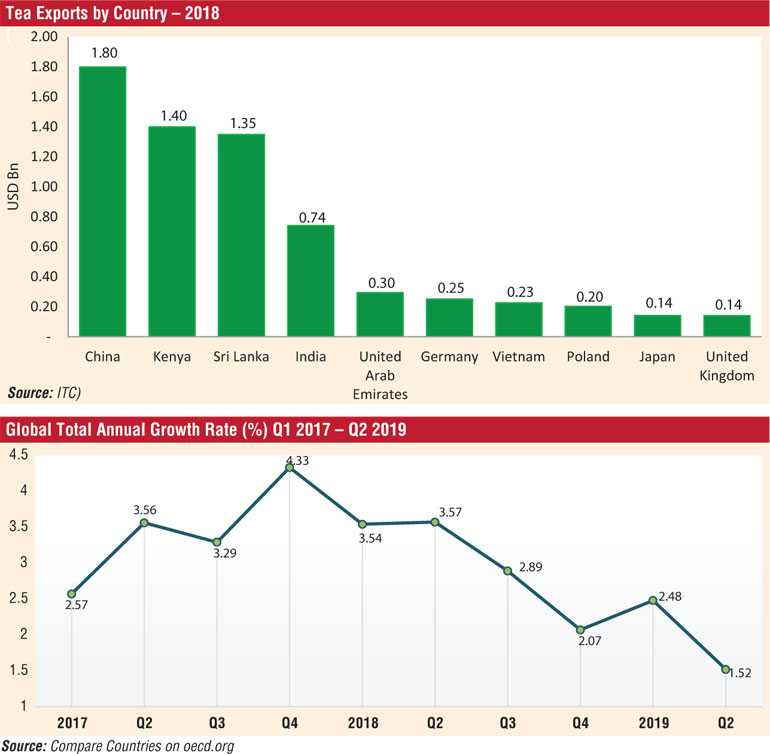
Global growth has continued to soften this year. Subdued investments in emerging markets and developing economics are dampening potential growth prospects. The global growth in 2019 is expected to slow to 2.6% reflecting weaker than expected trade and investment. Growth is projected to gradually rise to 2.8% by 2021.
East Asia and Pacific region
Growth in East Asia and Pacific region is projected to slow from 6.3% in 2018 to 5.9% in 2019. This is the first time since 1997-1998 Asian financial crises that growth in this region has dropped below 6%.
Europe and Central Asia
The regional growth is expected to firm to 2.7% in 2020. From a four year low of 1.6% this year as turkey recovers from an acute slow down. Excluding Turkey regional growth expected to grow 2.6% in 2020. Slightly up from 2.4% this year.
Middle East and North Africa
Regional growth is expected to rise to 3.2% in 2020, largely driven by rebound in growth among oil exporters. Growth among oil exporters is anticipated to pick up to 2.9% in 2020.
US economy
The US economy is expected to grow up to 2% in quarter four in 2019. Consumer spending has been the primary driver of growth. The trend is underpinned by solid Job Growth and wage increases.
China economy
China’s Economy could fall below 6% in 2020 even through the global economy is expected to pick up pace. The Chinese economy could grow at 5.8% next year slower than 6% forecast for 2019. Trade tensions, geopolitical tensions and uncertainty around the world have added further downside pressure on Chinese economy.
US Dollar
The US Federal Reserve cut interest rates for the third time this year. The fed lowered its benchmark rate by 0.25 basis points.
Global sales of tea exports by country totaled an estimated $7.76 billion in 2018. The value of worldwide tea exports fell by an average -0.5% for all exporting countries since in 2014 when tea shipments were valued at $ 7.8 billion.
Among the continents, Asian countries sold the highest dollar worth of exported tea during 2018 with shipments valued at $ 4.7 billion (60.1%) of global tea total. In the second place were African exporters at 23% while 13.2% of overall tea shipments originated from Europe.
World tea production depicts a similar volume year to date in comparison to 2018. However, a decline is witnessed in the last quarter of 2019. The market is expected to witness strong demand with the drop in volumes. US sanctions against Iran, political instability in the Middle East and trade wars could have an adverse effect on the price structure of the tea industry.