Sunday Feb 15, 2026
Sunday Feb 15, 2026
Wednesday, 7 June 2017 00:00 - - {{hitsCtrl.values.hits}}
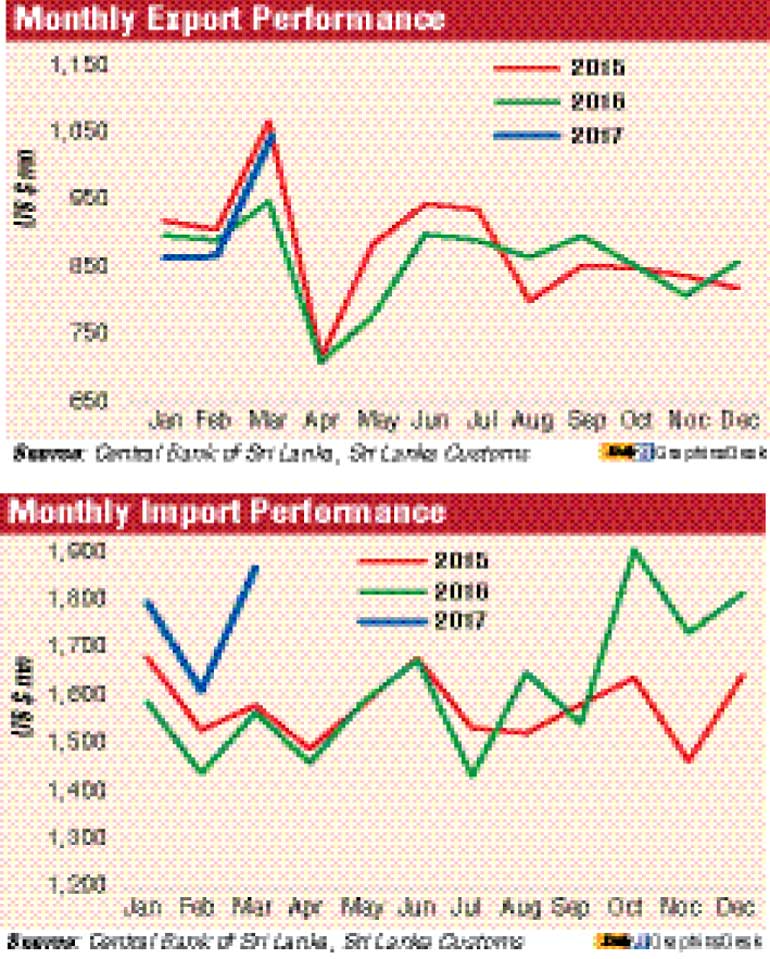
Exports rebounded in March, crossing the $ 1 billion mark and growing by 9.8% for the first time in two years and pushing up the numbers to record 1.3% growth in the first quarter of 2017, the Central Bank said yesterday.
The first quarter export data fell short of an earlier prediction made by the Export Development Board (EDB), which projected an export growth of 2% for the first three months of 2017.
Exports, which last grew by 4.7% in December 2016 to $ 859 million, saw rejuvenation in March driven mainly by apparel, agriculture and seafood.
On a cumulative basis, export earnings during the first three months of 2017 stood at $ 2,774 million, reflecting a 1.3% increase year-on-year with increased earnings from exports recorded in March 2017.
However, growth failed to rein in the trade deficit, which grew by 19.4% year-on-year to $ 1.8 billion in March 2017.
This was the highest import growth year-on-year recorded during a month since October 2014.
“The deficit in the trade balance widened substantially to $ 828 million in March 2017 compared to $ 617 million in March 2016. The cumulative trade deficit during the first three months of 2017 increased substantially to $ 2,505 million from $ 1,855 million recorded during the same period of 2016,” the Central Bank said in its External Performance report.
On a cumulative basis, expenditure on imports during the first three months of 2017 stood at $ 5,279 million, reflecting an increase of 14.9% year-on-year, led by expenditure incurred on fuel, gold and rice.
Earnings from agricultural exports grew for the fourth consecutive month, registering an increase of 28.3%, to $ 257 million in March 2017.
Improved export performance recorded in tea, seafood and spices contributed largely to the growth in agricultural exports. In spite of the decline in volume exported, earnings from tea exports increased by 18.6%, in value terms, due to a 22.9% year-on-year increase in prices. Earnings from seafood exports increased by 75.2%, year-on-year, in March 2017, reflecting a substantial increase in seafood exports to the EU market, following the removal of the fisheries ban.
In addition, earnings from spices exports showed a significant growth of 67.8% in March 2017, mainly due to the improved performance of cloves, cinnamon and pepper, owing to a significant increase in volumes.
All subcategories under agricultural exports increased during this period, except unmanufactured tobacco.
Earnings from industrial exports, which represent about 75% of total exports, grew by 4.7%, year-on-year, to $ 779 million in March 2017 led by higher earnings from textile and garment exports. Despite the year-on-year decline recorded during the previous two months, export earnings from textiles and garments increased by 2.6% to $ 453 million in March 2017, reflecting increased demand from the EU market. In addition, machinery and mechanical appliances, petroleum products, base metals and articles and rubber products also showed improved performance.
However, despite the notable increase recorded in the export of motorboats and jet skis, export earnings from transport equipment declined in March 2017, reflecting the base effect of exporting a cruise ship in March 2016. Further, earnings from food, beverages and tobacco, ceramic products and printing industry products also declined in March 2017.
Expenditure on imports increased by 19.4% year-on-year to $ 1,869 million in March 2017. This was the highest import growth year-on-year recorded during a month since October 2014. The largest contribution 76.9% to the overall growth was from intermediate goods, followed by consumer goods 15.9% and investment goods 6.4%.
Expenditure incurred on imports of intermediate goods increased in March 2017 by 32.6% year-on-year to $ 948 million, led by fuel imports. Import expenditure on fuel increased by 51.4% to $ 245 million driven by higher expenditure on refined petroleum and coal imports to fulfil the increased demand for thermal and coal-based power generation.
In addition, expenditure on imports of base metals, led by iron and steel, wheat and gold also contributed significantly to the high growth of imports of intermediate goods. However, the import of fertiliser and agricultural inputs declined in March 2017 when compared to March 2016.
Expenditure incurred on consumer goods imports increased by 11.5% year-on-year in March 2017 to $ 468 million driven by the increase in imports of food and beverages such as rice, dairy products and fruits. Rice imports increased to $ 53 million in March 2017 in comparison to the negligible amount of $ 0.9 million recorded in March 2016 due to measures taken to import rice to fulfil the shortage in the domestic market.
However, expenditure incurred on non-food consumer goods imports declined mainly due to the decline in expenditure incurred on the importation of clothing and accessories, vehicles, medical and pharmaceuticals and household and furniture items.
Import expenditure incurred on investment goods increased by 4.5% year-on-year to $ 450 million in March 2017 mainly due to increased imports of transport equipment. Import expenditure incurred on transport equipment increased by 31.9% led by road vehicles such as tankers and bowsers.
Import expenditure on building material increased, owing to the increase in iron and steel imports during the month. However, import expenditure on machinery and equipment declined by 3.6% year-on-year, mainly due to the decline in imports of telecommunication devices and machinery and equipment parts.
During the first quarter of the year, foreign investments in the CSE recorded a net inflow of $ 83.4 million, including net inflows of $ 35.2 million from the secondary market and inflows of $ 48.2 million to the primary market.
Foreign investments in the government securities market, which recorded net outflows of $ 150.7 million and $ 255.9 million in January and February 2017 respectively, indicated a reversal of the trend with a marginal net inflow of $ 1.1 million during March 2017.
However, on a cumulative basis, the government securities market experienced a net outflow of $ 405.5 million during the first quarter of 2017. Long-term loans to the Government recorded a net inflow of $ 28.9 million during the first three months of 2017, compared to a net outflow of $ 42.3 million during the corresponding period of 2016.
During the first quarter of 2017, the overall BOP is estimated to have recorded a deficit of $ 175.9 million in comparison to a deficit of $ 720.2 million recorded during the corresponding period of 2016. International Reserves and Exchange Rate Movements Sri Lanka’s gross official reserves, as at end March 2017, amounted to $ 5.1 billion, equivalent to 3.1 months of imports, while total foreign assets amounted to $ 7.1 billion, equivalent to 4.2 months of imports.
The rupee recorded a modest depreciation of 1.8% against the US dollar during the period from end 2016 to 5 June 2017. Furthermore, reflecting the cross currency movements, the rupee also depreciated against the euro by 8.1%, the pound sterling by 6.2%, the Japanese yen by 6.7%, the Canadian dollar by 1.6%, the Australian dollar by 4.6% and the Indian rupee by 6.8% during this period.


