Friday Jun 19, 2026
Friday Jun 19, 2026
Friday, 2 June 2017 00:10 - - {{hitsCtrl.values.hits}}
In February 2016, a report from the World Bank (WB) stated that a staggering 40% of the Lankan population are already in or are in risk of poverty. The  coalition responded to this by enacting the WBA bill which consolidated 39 welfare programs, while its very own Ravi Karunanayake belittled these claims, going as far as criticising those in this State as “…a barrier in the economy which disrupts the smooth operation of the free markets”. For a man educated at Oxford, the birthplace of modern humanism, I say, shame on you sir.
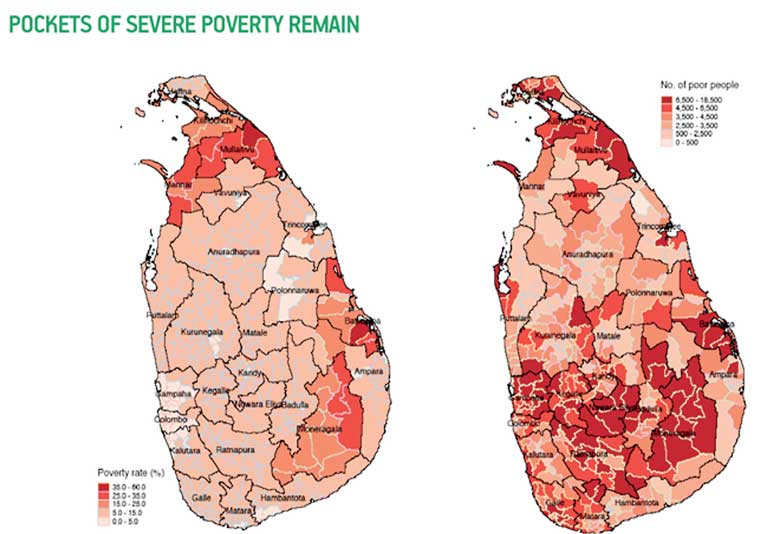
Furthering our understanding into the problem, it is undoubted that the civil war and its aftermath would always be the beginning for cause. Factors such as rural isolation, debasing and meddling economic exploitation, and in-access to micro-financing can be traced back to the war. Circumventing it, is the naive looting of corrupt politicians, as per the Household Income and Expenditure Survey (HIES), which clearly articulated that “certain social intervention benefits (Samurdhi) were being misappropriated to undeserving people unlike agri workers who actually needed it”. It is unquestionable that 90% of the poor live in rural areas, while 80% of the national population call it home as well. Due to the war and its aftermath, rural areas are isolated from social economic infrastructure, cities and markets, limiting income earned from non-farming activities. Moreover, 40% of the rural poor are small farmers; where their fragmented holdings, poor economies of scale, low investment levels and limited technology, continually drives these individuals into the poverty portfolio.
Yet, most of the programs in place to rectify these issues, whether it be SLFP or UNP, has always been protectionist. Welfare programs tend to keep those in poverty at the same level, not forgetting they never reach them, without empowering them to elevate themselves. Ideally this continual bleeding of cash in an already debt-ridden budget, does not do anything than carry in its inefficiencies to the next financial period. So how is it that the National Statistical Department continues to put out favourable poverty indexes for the world to see? The answer is simple manipulation. Similar to an accountant’s sleight of hand in presenting EOFY statements, these indexes have been clearly misrepresented. Poverty is a state of chronic poor-ism, classified by each state to fall under a specified income level (i.e. <3937/month). As stated earlier this level currently stands at 6.8%. But transient poor or near poor as we know is a state of being in risk of falling into acute poverty. Thereby, our nation’s bright idea of addressing this issue is to mis-classify these two levels to reduce those under the poverty level. The same WB report also stated that if we increase the poverty level to <5000/month (an increase of 63%) it would increase the poverty level to 22% (i.e. an increase of 300%). According to Will Mcavoy from the drama series the Newsroom, the first step of solving a problem is to recognise that you have one. And I suggest we do the same.
(www.jemuelcj.wordpress.com)


