Wednesday Feb 18, 2026
Wednesday Feb 18, 2026
Wednesday, 3 May 2017 00:00 - - {{hitsCtrl.values.hits}}
By Eshini Ekanayake
Almost two years since Sri Lanka released a rebased GDP series which saw a slowdown in GDP growth from 2012, there remains public debate on the accuracy of the numbers. Just recently, there were public discussions claiming that the exercise to change the framework in calculating the country’s GDP came from a political decision ahead of the general election scheduled for August 2015. Skeptics hold the view that the objective to rebase GDP came from a desire to show that real GDP growth in 2013 and 2014 was actually much slower to gain political clout.
Despite GDP becoming an increasingly poor measure of prosperity in a country, it’s still the most important economic variable there is to analyse business cycles and the output gap for markets and policy makers. Therefore, given that there is a lingering confusion and lack of confidence on the GDP growth numbers we have shared our insights in to the GDP framework adopted by the Department of Census and Statistics (DCS).
Rebasing the GDP series was required as changes in relative prices and the structure of the economy can have an upward-bias on growth rates.
 The change in relative prices over time leads to an upward bias in real GDP growth
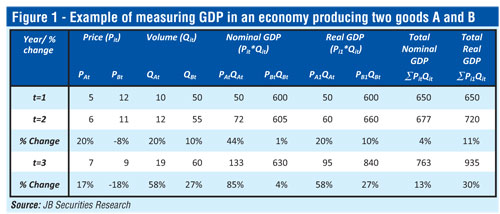
GDP is a quantitative indicator of the size and composition of a country’s economy. It is estimated by aggregating the price structures and volumes for the underlying goods and services produced in an economy during a specific time period. In Sri Lanka, the method currently used to measure GDP is a fixed-base year approach, where a reference year (base year) is determined and forward projections are made according to the relative prices and economic activities tracked from thatbenchmark. To isolate the volume change in the economy in subsequent years or what is generally known as ‘real GDP’, each product item needs to be deflated by the price increases since the base year prices are used as weights. In essence, it is a Laspeyers index that is used to estimate real GDP, where prices and economic activities of the first year (in this case the base year) are held constant. We can easily illustrate this exercise using an example of a simple economy that produces only two goods A and B (i=A,B) (Figure 1).
Over time forward projections of the current benchmark can become unrepresented as there can be changes in the relative prices along with structural changes in the economy which can over-estimate the size of traditionally dominant sectors. This is due to the substitution effect that occurs when relative price changes. Goods and services that become relatively cheaper over time can see higher demand as consumers switch their purchases away from items that are comparably more expensive. Therefore, when base year prices are usedit can overstate inflation in sectorsthat are faster growing, showing less real growth and underestimate inflation in slow growing sectors which leads to higher real growth. The aggregate effect of this estimation method leads to a higher real GDP growth rates for the economy with an upward bias as weights become outdated. This is especially true for a developing economy such as Sri Lanka which experiences more significant changes in its economic structure than a developed economy over time.
Due to this drawback, the United Nations Statistical Commission (UNSC) recommends changing the base year every five years, however Sri Lanka had not done so since 2002. Thus, the change in the base year of the GDP series from 2002 to 2010 was required to adopt an updated set of reference prices, and economic activities to value the real size of the economy with more accuracy.
The coverage of economic activity tracked for estimating output was expanded to includenew sectors- (1) plant propagation and agricultural support activities, (2) sewerage, waste collection, treatment and disposal activities; materials recovery, (3) programming and broadcasting activities, (4) IT programming consultancy and related activities, information service activities, and (5) professional services. The inclusion of these sectors likely resulted in the share of the services in the calculation of GDP increasing. However, % shares cannot be compared between the old and new GDP series, as the old series was calculated based on producer prices (inclusive of taxes and exclusive subsidies), whereas the new GDP series is calculated in basic prices (exclusive of taxes and inclusive of any subsidy receivable). Therefore, sectoral valuations are not adjusted for taxes and subsidies on products. As such Gross Value Added (GVA) is estimated initially to which total taxes are added and subsidies are removed to estimate total GDP.
Along with an expanded production coverage, DCS also included new data sources to enhance the estimation process. These were largely administrative data sources, which supplemented survey data, resulting in a more direct engagement for DCS with stakeholder agencies. This allowed DCS to cover almost all service sector activities with better accuracy, consequently providing a further dissemination ofdata for economic activities.
The new GDP (2010=100) series is a good effort by DCS to improve the quality of GDP estimation in the country. However, rebasing GDP in any country is an ongoing process as measuring the output of a dynamic economy is a complex task. According to discussions with DCS officials, the first economic census of the country where 2013 was considered as a reference year was completed in 2015, which they claim depicts a more accurate structure of the country’s economy. Therefore, DCS is currently working on rebasing the GDP series to 2015 using the economic census, with the expectation of releasing it by early 2018.
The new GDP series however is likely to be backdated only till 2015. In the absence of a longer back dated time series data any meaningful analysis of economic cycles, past trends and estimation of the output gap will be a challenge. Although, on a positive note, given the drawbacks of a fixed-base approach, they also plan to later shift towards a chain linking method to estimate real GDP which is more widely practiced in advanced economies. The chain linking method estimates the volume of output each year in the prices of the preceding year.The more up-to-date weights in the chain-linked approach eliminates the upward bias in growth rates produced under the fixed-base method.
In addition to re-basing GDP there were also statistical and conceptual changes made to better reflect international best practices, leading to an enhanced GDP framework in the country. These include:
1.Adopting the latest UN System of National Accounts 2008 (SNA-2008). Compared to the old system there are 118 changes made in the SNA-2008 version.
2.Re-classification of industries according to the International Standard of Industry Classification (ISIC). This has resulted in further breakdown of GDP data, and facilitates international comparison.
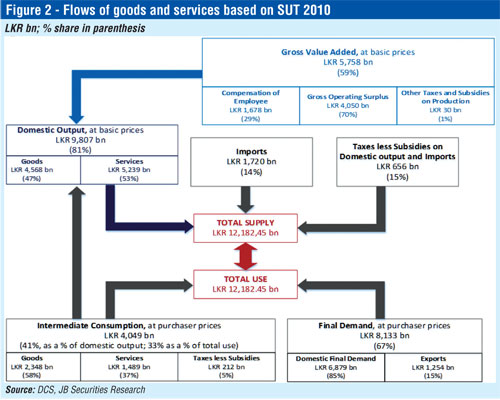
3.Development of Supply and Use Table (SUT) 2010 (Figure 2), which have the benefits of, (1) providing a consistency tool in compiling GDP by 3 approaches (production method, income method, and expenditure method), (2) describing linkages among industries, products and sectors, and (3) providing a source of data for compiling the Input-Output (I-O) table.
According to the SNA-2008 this methodology provides an improved framework for producing volume estimates at a very detailed level as it requires deflating each component by a strictly appropriate price index.
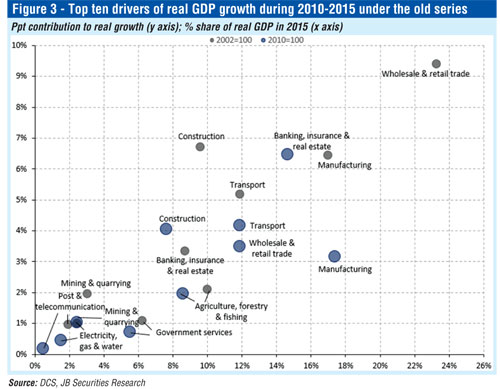
Top five contributors to growth previously now contribute less under the new series
Real GDP under the new series grew by 34.6% during 2010-2015 vs. 40.1% during the same period in the old series. Despite the variation in sectoral valuations in both series (basic prices vs. producer prices), given that taxes minus subsidies only accounted 2.5 ppts of growth during this period (under the new GDP series), we have compared the production sectors that contributed to growth under both the series. This analysis indicates that the top five sectors-wholesale and retail trade, construction, manufacturing, transport, banking insurance and real estate, that contributed to 31 ppts to real GDP growth during 2010-2015 and accounted for 70% of total GDP, now contributed only 21 ppts to growth, accounting for only 63% of GVA in the new series (Figure 3). This deviation could partly be explained by ‘other personal service activities’ which was formerly included in ‘private services’, contributing the most to growth at 4.3 ppts during this period, and accounting for 11% of GVA in the new series. This is in contrast to ‘private services’ which contributed only 0.8 ppts to growth and accounted for 2.3% of GDP in the old series.
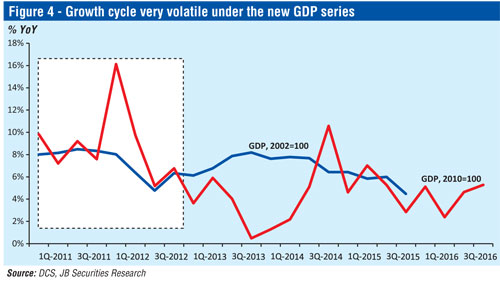
Typically, when GDP is rebased, despite it resulting in an upward drift to the measure, the change in relative prices and a higher base effect will tend to reduce real growth rates previously recorded so that it must be revised downwards. However, in Sri Lanka’s case what is seen is even though GDP moved to a higher nominal level in 2010, substantially higher GDP growth rates are recorded thereafter in 2011 and 2012 of 8.4% and 9.1% vs. 8.2% and 6.3% (respectively) under the old series, followed by a significant slowdown in the pace of growth thereafter (Figure 4). While this has not been the experience for other countries that did a similar exercise, in Sri Lanka’s case the bump in GDP growth in 2011 and 2012 could partly reflect the ‘peace dividend’ due to post conflict reconstruction efforts and increased capacity in the economy as the North and East gradually returned to normalcy, which was underestimated in the earlier series. Thus, with that effect tapering off in the subsequent years GDP retuned to a slower growth path averaging at 4.4% thereafter.
 It is also unlikely that the GDP deflator led to this effect as it averaged at 8.8%, which was similar to CCPI inflation at that time. CCPI inflation is a close proxy to the GDP deflator given the dominance of the service sector in the economy (correlation of 0.7).
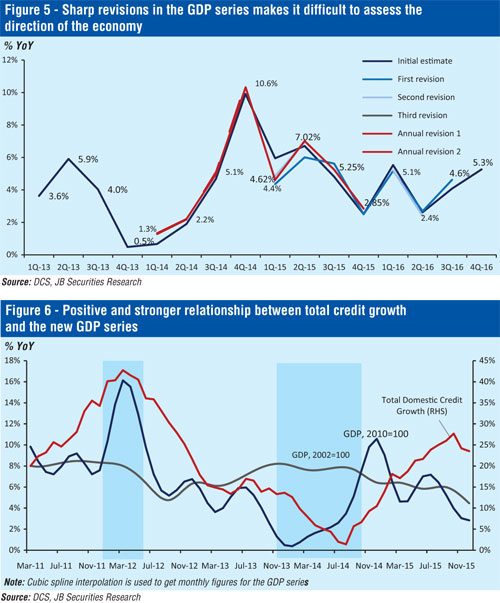
Despite the number of improvements made to the GDP framework the new GDP series has resulted in larger swings in the quarterly growth numbers making the growth cycle unpredictable under the new series (Figure 4). This along with frequent and large revisions has added to the confusion leading to much criticism (Figure 5).
Under the old GDP series, the correlation between total domestic credit growth and GDP was negative and weak during the period 2010-2015. Our analysis shows that correlation was a negative 0.09 which is a difficult conundrum, given that typically credit growth and GDP growth have a closer link. However, this may be partly explained by fund flows from non-bank sources such as FDI, corporate debt, and equity issuances during this period. In contrast under the new series, the correlation between total domestic credit growth and GDP growth is stronger and positive at 0.68 (Figure 6). In addition to the rebasing of the GDP series, the expanded coverage of economic activity likely led to this result.
According to the new GDP series, 2012 experienced a much higher growth rate of 9.1% from 8.4% in 2011. This contrasts with the slowdown in GDP growth to 6.3% in 2012 from 8.2% in 2011 under the old GDP series. Increased GDP growth in 2012 under the new series comes against a background of three policy rate hikes (SRR increased by 100bps, repo rate by 75bps, and the re-repo rate by 125bps) as total credit growth peaked at 42.7% YoY in March-2012, and heavy downward pressure on the currency.
 Despite global oil prices increasing over USD 120/bbl, the government did not increase domestic petroleum prices, which put further pressure on the BoP as domestic demand for oil was not curtailed. This also led to CPC and CEB borrowing heavily from private sector commercial banks with credit to SOEs peaking at 107.7% YoY in May-2012. However, during this time private sector credit growth remained strong, peaking at 35.2% in March-2012. Many media reports highlighted the higher growth rate in 2012 under the new GDP series as an inconsistency with macroeconomic fundamentals. However, it is likely that these adjustments impacted the real economy albeit with a lag, as GDP growth that peaked at 9.1% then decelerated to 3.4% in 2013. This is more in line with empirical evidence-a peak in credit growth is followed by a peak in GDP growth, where as a trough in GDP growth is followed by a trough in credit growth (Figure 6). A slow-down in GDP growth follows the slow-down in credit growth, whereas the real economy recovers before the recovery in credit growth. This is because in an expansionary phase, credit is used to increase productive capacity and build inventory, whereas when an economy is recovering from a slowdown, utilisation of existing capacity needs to improve prior to further expansion in capacity which requires additional credit.
Even though over time the methodology to estimateGDP has improved, it is still prone to constant and substantial revisions. This is of no surprise given that aggregating a complex and growing economyin to one single value is no easy task. This is especially true for today’s economies where there is an increasing focus geared towards innovation. Thereby focusing only on the change in prices and volume in an economy can at times miss improvements made to the quality of goods and services produced. As an example, if you take a smartphone that’s produced this year which costs more than last year, the increased price is likely not solelydue to inflation, but rather it being a superior version of the earlier product. Therefore, the failure to capture improvement in quality implies that inflation is likely to be overstated when estimating GDP. This impact is larger over a longer period of time- a feature phone produced ten years ago in real prices is likely to cost the same as a smartphone produced now, although the significant improvement of the utility gained for the consumer will not be captured in GDP.Similarly, services which tend to be more bespoke with an increasing focus on the experience for the consumer rather than the cost, can be difficult to measure quantitatively.
Despite these drawbacks, GDP is still the indicator that is most commonly used by our policy makers to measure the prosperity of the country. However, ultimately what truly matters is whether GDP filters down towards household incomes and whether they are better-off than they were a year ago.
(The writer is Economist, JB Securities and can be reached via [email protected] or +94 112 490 932.)


