Thursday Jul 30, 2026
Thursday Jul 30, 2026
Tuesday, 28 March 2017 00:00 - - {{hitsCtrl.values.hits}}
Sri Lanka’s exports bounced back in December but ended 2016 on a negative note whilst soaring imports saw the country’s trade deficit widen by 8.4% to $ 90.09 billion.
Releasing the latest external sector data, the Central Bank said yesterday that the country’s performance was “mixed” in December 2016.
The trade deficit expanded as a result of the considerable increase in import expenditure, which more than offset the growth in export earnings during December 2016. On a positive note, both earnings from tourism and workers’ remittances grew at a healthy rate year-on-year during the month. The government securities market witnessed a net outflow in December, while some inflows to the Colombo Stock Exchange (CSE) were observed.
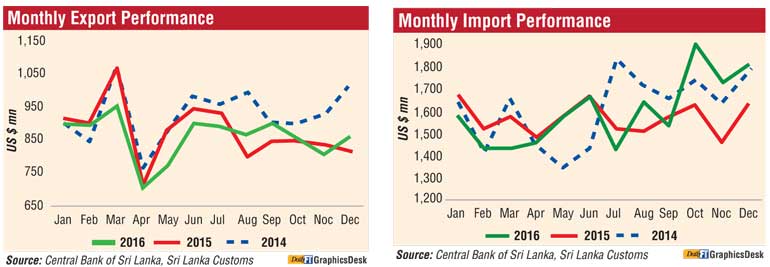
Earnings from exports amounted to $ 859 million in December 2016, registering a 4.7% growth year-on-year, reflecting increases in all major categories of exports. The performance of industrial and agricultural exports appears to have benefitted from the gradual improvements in global economic conditions and improved trade relations with major trade partners, which in turn led exports to expand in December.
The largest contribution to the growth in exports was from industrial exports supported by the substantial increase in exports of printing industry products and rubber products. Accordingly, earnings from industrial exports, which account for about 76% of total exports, grew by 4.4% year-on-year to $ 655 million in December. Export earnings from printing industry products increased by more than twofold compared to the same month in 2015 mainly as a result of the increase in exports of currency notes.
Continuing the year-on-year growth trend observed since August 2016, export earnings from rubber products increased by 6.7%, mainly due to growth in the exports of surgical and other types of gloves. However, earnings from garment exports, which account for around 43% of total export earnings, declined marginally by 0.3% year-on-year to $ 368 million due to lower demand from the US market, despite the growth in exports to non-traditional markets such as Canada, China, Australia and the UAE as well as to the European Union (EU) market. Earnings from all categories of industrial exports increased during the month, except food, beverages and tobacco.
Earnings from agricultural exports, which account for about 23% of total exports, grew by 5.1% year on year to $ 201 million in December, led by spices, coconut and tea exports.
Earnings from spices exports grew notably by 31.1% year-on-year, reflecting a growth in relation to all varieties of spices, particularly pepper and nutmeg. The sound performance of both kernel and non-kernel coconut products led earnings from coconut exports to grow by 20.4% year-on-year.
Earnings from tea exports in December increased by 4.4% year-on-year due to a higher average export price despite the decline in export volume. In addition, earnings from seafood exports continued the impressive growth momentum observed since July 2016 after lifting the ban on seafood imports from Sri Lanka to the EU.
On a cumulative basis, export earnings during 2016 at $ 10,310 million, contracted by 2.2% compared to the previous year, despite the positive growth recorded in the latter part of 2016.
The largest contribution to this decline came from transport equipment as a result of the base effect, while petroleum products, tea and spices also contributed negatively. Low commodity prices in the international market and reduced domestic output of export-oriented agricultural products contributed to the decline in exports. However, export earnings from textiles and garments, base metals and articles, leather, travel goods and footwear and machinery and mechanical appliances increased in 2016 when compared with 2015. The leading markets for merchandise exports of Sri Lanka during 2016 were the US, the UK, India, Germany and Italy accounting for about 52% of total exports.
Import performance
Double-digit growth in imports was recorded for a third consecutive month in December 2016. Accordingly, expenditure on imports at $ 1,816 million increased by 10.4% year-on-year during the month due to the increase in expenditure on the import of intermediate goods followed by investment goods. However, the year-on-year declining trend in expenditure on consumer goods that started in December 2015 continued in December 2016.
Expenditure on intermediate goods, which accounts for 55% of total imports, rose by 17.3% in December, passing the $ 1 billion mark for the first time since August 2014. The increase in expenditure on fuel imports by 52% largely contributed to the growth in imports. This included a 114% growth in refined petroleum imports and a 10.4% rise in coal imports due to higher thermal and coal power generation as a result of the prevailing drought conditions.
Imports expenditure on diamonds, precious stones and metals also grew substantially in December due to increased imports of gold. Base metals, led by iron and non-alloy steel, and copper wires and mineral products, led by cement clinkers, also contributed to the growth in import expenditure. However, expenditure on fertiliser, textiles and textile articles, wheat and maize and food preparation imports declined in December 2016 year-on-year.
Expenditure on investment goods, which accounts for about 25% of total imports, increased by 13.1% year-on-year in December 2016. Continued expansion in the construction sector was a key reason for the growth in investment goods imports. Import expenditure on machinery and equipment increased by 12.2% year-on-year in December 2016, led by engineering equipment, electrical machinery and equipment and office machines.
Expenditure on building material imports increased by 15.2% during the month mainly due to increased imports of cement, iron and steel and articles thereof. In addition, import expenditure on transport equipment increased owing to higher expenditure on railway track construction equipment and chassis, despite a substantial decline in imports of road vehicles such as auto-trishaws and cabs used for commercial purposes.
Expenditure on consumer goods imports contracted in December by 7.7%, reflecting declines in both food and beverages and non-food consumer good categories. Nevertheless, within the food and beverage category, the import of sugar and confectionery, dairy products and beverages increased. With respect to non-food consumer goods, import expenditure on medical and pharmaceuticals, vehicles, home appliances and clothing and accessories declined.
On a cumulative basis, expenditure on imports during 2016 at $ 19,400 million, reflected an increase of 2.5% compared to the previous year, mainly due to higher imports of machinery and equipment, textiles and textile articles and gold. In addition, building material, sugar and confectionery and medical and pharmaceuticals also contributed considerably to the increase in import expenditure. However, expenditure on personal vehicles, fuel and fertiliser imports declined in 2016 from the level observed in 2015.
China, India, the UAE, Singapore and Japan were the main import origins in 2016, accounting for about 57% of total imports.
Trade balance
Continuing the trend observed in the last two months, the deficit in the trade balance widened substantially to $ 957 million in December from $ 824 million a year ago. The cumulative trade deficit in 2016 rose to $ 9.09 billion from $ 8.38 billion in 2015.


