Sunday Jul 26, 2026
Sunday Jul 26, 2026
Monday, 13 March 2017 00:10 - - {{hitsCtrl.values.hits}}
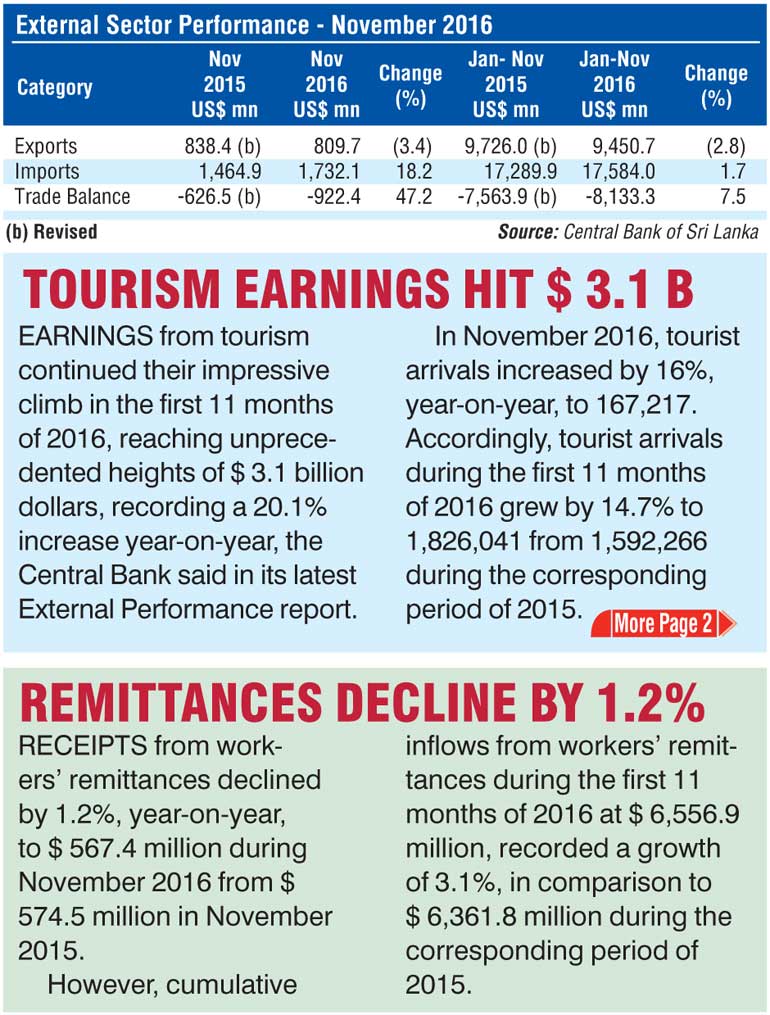
Sri Lanka’s trade balance jumped 47.2% in November 2016 when compared with the same month in the previous year underpinned by a 3.4% drop in export earnings, which was marked by lower shipments of textiles and tea, reversing the year-on-year increasing trend in the previous three months as well as an 18.2% uptick in imports, the Central Bank said.
Releasing its latest External Performance Report, the Central Bank acknowledged the deficit in the trade balance “widened substantially” to $ 922 million in November 2016 compared to $ 626 million in November 2015. The cumulative trade deficit during the first 11 months of 2016 increased to $ 8,133 million from $ 7,564 million recorded during the same period of 2015.
Earnings from exports at $ 810 million in November 2016 declined by 3.4% from $ 838 million.
“Reversing the year-on-year increasing trend observed during the past three months. Agricultural exports, led by minor agricultural products, spices and tea and industrial exports led by textiles and garments and gems, diamonds and jewellery, mainly contributed to this contraction,” the Central Bank report said.
Earnings from agricultural exports, which account for about 23% of total exports, declined by 8.3%, year-on-year, to $ 183 million in November 2016. Earnings from minor agricultural product exports declined substantially by 63.2%, year-on-year, mainly due to the decline in edible nuts owing to lower seasonal supply while spice exports contracted by 25.4% with significant decline in pepper and cinnamon exports.
Earnings from tea exports declined by 6.6%, year-on-year, to $ 101 million, reflecting lower export volume, despite the increase in average export prices by 20.4% in November 2016, which has been increasing continuously since August 2016.
However, total earnings from seafood exports increased by 18.2%, year-on-year, in November 2016, continuing its impressive growth performance since the lifting of the ban on seafood exports from Sri Lanka to the European Union (EU). Seafood exports to the EU market grew substantially by 171.2%, year-on-year.
Earnings from industrial exports, which account for about 77% of total exports, declined by 2%, year-on-year, to $ 624 million in November 2016. Export earnings from textiles and garments, which account for around 47% of total export earnings, declined by 6.6%, year-on-year, to $ 383 million in November 2016, reflecting lower garment exports to both traditional and non-traditional markets. Earnings from the export of gems, diamonds and jewellery contracted by 47.1%, year-on-year, in November 2016 due to the lower performance in all subsectors.
However, export earnings from printing industry products increased by more than twentyfold, mainly as a result of the increase in exports of currency notes. Earnings from petroleum products rose owing to increased income from bunker and aviation fuel as a result of higher bunkering prices and volumes.
On a cumulative basis, export earnings during the first 11 months of 2016 at $ 9,451 million, contracted by 2.8%, year-on-year, mainly due to lower exports of transport equipment and petroleum products.
In addition, agricultural exports such as tea and spices contributed considerably to the decline in exports during this period. However, earnings from textile and garment exports increased during the first 11 months of 2016 due to higher garment exports mainly to non-traditional markets with a marginal increase to the EU market despite a decline recorded to the US market.
The leading markets for merchandise exports of Sri Lanka during the first 11 months of 2016 were the US, the UK, India, Germany and Italy accounting for about 52% of total exports.
Expenditure on imports increased by 18.2%, year-on-year, to $ 1,732 million in November 2016, due to increased expenditure on certain intermediate goods and investment goods. Import expenditure on consumer goods registered a marginal decline of 0.8% during the month.
Expenditure on imports of intermediate goods increased by 27.8%, year-on-year, to $ 883 million in November 2016. This increase was largely driven by an increase in expenditure on textiles and textile articles, coal, gold, base metals and cement clinkers. Import expenditure on textiles and textile articles increased by 54.1% mainly due to an increase in fabric imports.
Import expenditure on crude oil increased by 5.8% while import expenditure on refined petroleum products declined by 1.2% during this month. Due to the increase in both volumes and unit prices, import expenditure on coal increased by 166.3%.
Import expenditure on investment goods recorded an increase of 20.4%, year-on-year, during November 2016. Imports of all three categories of investment goods increased significantly, with machinery and equipment, building material and transport equipment increasing by 25%, 12.7% and 22.5% respectively, on a year-on-year basis. Engineering, electronic, medical and laboratory equipment and machinery and equipment parts mainly contributed to the growth in imports of machinery and equipment. All subcategories of building material imports also increased except for cement.
Expenditure on consumer goods imports contracted in November 2016, largely due to lower imports of vehicles for personal use categorised as other consumer goods, in spite of a significant increase in expenditure on food and beverages. The increase in import expenditure on food and beverages was driven mainly by higher import volumes and prices of sugar. Import expenditure on dhal, milk powder and fruits also increased due to larger import volumes.
Cumulative import expenditure
On a cumulative basis, import expenditure during the first 11 months of 2016 at $ 17,584 million registered a year-on-year growth of 1.7 %. Higher imports of investment goods mainly contributed to this growth while the import of intermediate goods also contributed to the growth. However, import expenditure on consumer goods declined during this period largely due to reduced imports of nonfood consumer goods as a result of significantly lower motor vehicle imports.
China, India, Singapore, the UAE and Japan were the main import origins during the first 11 months of 2016, accounting for about 58% of total imports.
Foreign investments in the CSE recorded a net inflow of $ 2 million in November 2016. Cumulative foreign investments in the CSE during the first 11 months of 2016 recorded a net outflow of $ 8.7 million. This included a net outflow of $ 10.4 million from the secondary market and an inflow of $ 1.7 million to the primary market. As witnessed during October 2016, foreign investments in the government securities market continued to record a net outflow amounting to $ 119.2 million in November 2016.
On a cumulative basis, the net outflow of foreign investments in the government securities market amounted to $ 228.4 million during the first 11 months of the year in comparison to a net outflow of $ 1,092.2 million during the corresponding period of 2015.
Long-term loans to the Government increased to $ 1,109.7 million on a net basis during the first 11 months of 2016, in comparison to a net inflow of $ 210.3 million during the same period of 2015.
During the year up to end November 2016, the overall BOP is estimated to have recorded a deficit of $ 635.3 million, in comparison to a deficit of $ 1,274.2 million recorded during the corresponding period of 2015.
Sri Lanka’s gross official reserves as at end November 2016 amounted to $ 5.6 billion, equivalent to 3.5 months of imports. Meanwhile, total foreign assets, which include gross official reserves and foreign assets owned by deposit taking corporations, stood at $ 7.9 billion, equivalent to 4.9 months of imports.
The rupee, which depreciated by 3.8% against the US dollar in 2016, recorded a further depreciation of 1% by 8 March 2017.
Reflecting cross currency movements, the rupee also depreciated against the euro by 1.2%, the pound sterling by 0.3%, the Japanese yen by 3.2%, the Canadian dollar by 1.4%, the Australian dollar by 5.6% and the Indian rupee by 2.8% during the year up to 8 March 2017.

