Saturday Feb 21, 2026
Saturday Feb 21, 2026
Thursday, 16 February 2017 00:00 - - {{hitsCtrl.values.hits}}
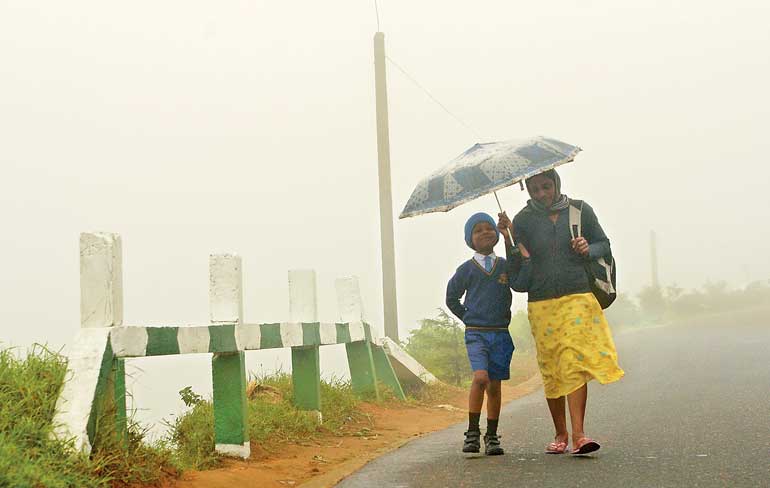
A boy going to school on a misty morning up country. More than 500 schools in Sri Lanka are without basic sanitary facilities and only around 1,200 schools have science education going beyond Ordinary Level, while only 1.9% of GDP was used for education in 2015 – Pic by Shehan Gunasekara
It can be safely stated that most of the time our rhetoricians are not mathematicians. The current state of STEM education is enough evidence. Though rhetoric is flowing freely and forcefully and in abundance the reality is that it is only what we have had for much of the time – no insights, no solutions. 
The earliest perhaps well-known and heard of rhetorician and a mathematician was Pythagoras. Some say that his real name is not known but this is a nickname bestowed on him by his ardent followers. The name is supposed to mean “He who spoke truth like an oracle”. It was the quantification of a situation and the lucidity of delivery that had set him apart from the crowds or rather reason for crowds crowding him to listen to!
Pythagoras believed and worked to demonstrate that all objects can be described by using numbers and ratios. It is said that Pythagoras and his followers were the first (may be if taken the Greek civilisation) to understand the world through imagination and not via religion or empirical data. His imagination was connected to expressing situation via numbers and then understanding.
Today I produce lines of data available from our country on various issues taken from both primary and secondary sources. I wish no order in this nor any subject preference. We produce data for many areas but they do for most of the time stay on as data serving very much less than their potential.
Data have stories embedded upon analysis and properly utilised can give rich dividends. In our rhetoric we should perhaps not simply rattle out odd bits of data indicating that as the problem and the only solution too but look at the form of data in more detail. The following data thus carry stories and there are connectivity too.
Resolving one can solve another and perhaps therein lies the need for understanding the form, the pattern. The sources are not indicated for the sake of space and to give the data line more prominence but are available upon inquiry.
Do you see when you scan the list interesting lines of data, ammunition for taking opponents or opportunities and challenges that need to be tackled?
Victor Hugo has reputed to have said, “He who opens a school door, closes a prison”. We may have data on schools closing and crime rates going up as two distinct data points and two ministries (at least) trying to solve these situations separately. Do we ever use the data together and think creatively to have a plan that understands such connectivity?
Do we associate our successful achievement of some of the MDG goals even before some have identified MDGs in the first place to our successful education process at the time? Today with tuition and schemes of education where learning and values being not at the centre of the equation, do we feel ashamed of still some schools having no sanitation facilities? The state of some of the existing facilities may shock us too if we take a closer look.
Again we have written on this column the possibility of tons of garbage should be an integrated exercise between three ministries – environment, power and energy and agriculture. When bringing in gully bowsers and septage transport we may actually include Ministry of Water supply too with the same solution! Biogas – an integrated solution that defies current rules and regulations but actually would solve the problem.
It is not about for each and every issue creating inter-ministerial committees but allowing fruitful public sector alliances in a fluid manner with flexibility and allowances when such opportunities are seen. I do hope we can have a Daily FT index such as Harper’s Index where the mosaic of data can be looked into with an open and an analytical mindset to understand the multiplicity with the broadsheet providing the canvas for the citizens.


