Saturday Feb 28, 2026
Saturday Feb 28, 2026
Monday, 9 January 2017 00:35 - - {{hitsCtrl.values.hits}}
Preliminary figures released last week by the International Civil Aviation Organization (ICAO) indicated that the total number of passengers carried on scheduled services reached 3.7 billion in 2016, a 6.0% increase over last year.
The number of departures rose to approximately 35 million globally, and world passenger traffic, expressed in terms of total scheduled revenue passenger-kilometres (RPKs), posted an increase of 6.3%, with approximately 7,015 billion RPKs performed. This growth is a slowdown from the 7.1% achieved in 2015.
Over half of the world’s tourists who travel across international borders each year were transported by air. Air transport carries some 35% of world trade by value. More than 90% of cross border Business to Consumer (B2C) e-commerce was carried by air transport.
Growth helped by lower travel cost
The forecast of world real gross domestic product (GDP) growth in 2016 is expected to be at around 2.4%, down from the 2.9% pace projection at the beginning of the year. The revision is due to sluggish growth in advanced economies, stubbornly low commodity prices, weak global trade, and diminishing capital flows. Despite the weak economic conditions, global passenger traffic continued to grow helped by the lower air fares owing to the fall in oil prices.
Passenger traffic
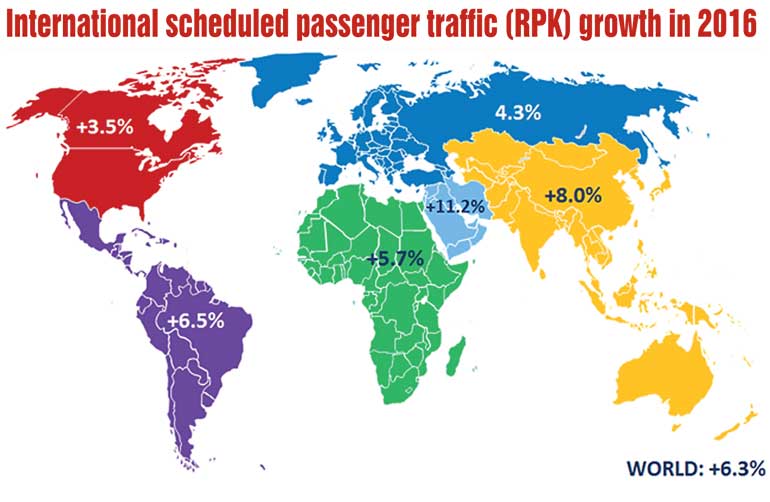
International scheduled passenger traffic expressed in terms of RPKs grew by 6.3% in 2016, down from the 7.0% recorded in 2015. All regions, except for Africa and the Middle East, posted slower growth than last year. Europe accounted for the largest share of international RPKs with 36%, and increased by 4.3%. Asia/Pacific had the second largest share with 29%, and grew by 8.0%. The Middle East region carried 15% RPK share and recorded a growth of 11.2% compared to 2015. North America, with a 13% share, experienced the lowest pace of growth among all regions at 3.5%. Carriers in Latin America and the Caribbean managed 4% of world international RPKs and recorded a growth of 6.5%. Africa with a 3% share saw an improvement from 2.3% growth registered in 2015 to 5.7% in 2016.
In terms of domestic scheduled air services, overall markets grew by 6.2% in 2016, down from the 7.3% growth recorded in 2015. North America, the world’s largest domestic market with 43% share of the world domestic scheduled traffic, grew by 4.9% in 2016. Owing to the strong demand in India and China, the Asia/Pacific region, grew strongly by 10.0% in 2016 and accounted for 40% of world domestic scheduled traffic.
Low-cost carrier activity
The low-cost carriers accounted for approximately 28% of the world total scheduled passengers in 2016 and passengers carried crossed the milestone of 1 billion passengers in 2016. LCCs in Europe represented 32% of total passengers carried by LCCs, followed by Asia/Pacific and North America with 31% and 25%, respectively. The increasing presence of low-cost carriers notably in emerging economies has contributed to the overall growth of passenger traffic.
Load factors slipped
Total capacity offered by the world’s airlines, expressed in available seat-kilometres, increased globally by around 6.4%. As a result, overall load factor dropped slightly from 80.4 in 2015 to 80.3 this year. Load factor varies by region, ranging from 68.0% for Africa to 83.3% for North America. Load factor of the Middle East is under pressure with the continued strong capacity expansion outpacing the traffic growth. Load factor of the region is expected to decline from 76.3% in 2015 to 74.7% in 2016.
Air cargo picked up but remained challenging
World scheduled freight traffic, measured in freight tonne-kilometres (FTK), grew by 2.6% in 2016, a slight improvement from the 1.7% growth registered in 2015. The international segment of freight traffic, which represents nearly 87% of total air freight, grew by around 2.5%, up from the 1.8% growth in 2015. The scheduled international freight load factor declined from around 47% in 2015 to 46% in 2016.
Airline financial results
Fuel accounted for nearly a fifth of the Industry’s operating costs in 2016, while it accounted for a third in 2015. Significant decrease in fuel costs helped airlines to maintain their operating profit at the same level as the previous year: the airline industry is expected to end 2016 with another record operating profit of around $ 60 billion and an operating margin of 8.0%. This comes after an operating profit of $ 58 billion and an operating margin of 8.0% in 2015. For a consecutive year, more than a third of the profits are expected to come from the carriers of North America, whose domestic market represents 66% of their total operations.
Improving economic conditions forecast by the World Bank will see traffic growth and air carrier profitability momentum continuing in 2017.