Wednesday Feb 18, 2026
Wednesday Feb 18, 2026
Thursday, 22 December 2016 00:09 - - {{hitsCtrl.values.hits}}
By Ceylon Tea Brokers Plc
The third quarter of the Sri Lankan tea industry saw an upward momentum with increased demand being observed from some of the major importers of Ceylon Tea. Increased demand from Turkey, Iraq and sanction free Iran helped recover the industry, some of its lost momentum in the penultimate quarter of the year.
Oil prices which slumped in the first half of the year which picked up in the second quarter has shown stability running into the third quarter which contributed to a healthier GDP in some of our major tea importing countries where oil is the number one revenue generator.
Whilst Iraq, Syria and Libya are grappled with internal strife and political instability, Russia’s economy continues to struggle with the imposed sanctions.
The sharp decline in production has been a major blow to the industry which might not reach 300 M Kgs by the end of the year. Whilst the production continues to dip YOY, the record level prices achieved could be mainly attributed to decline in production.
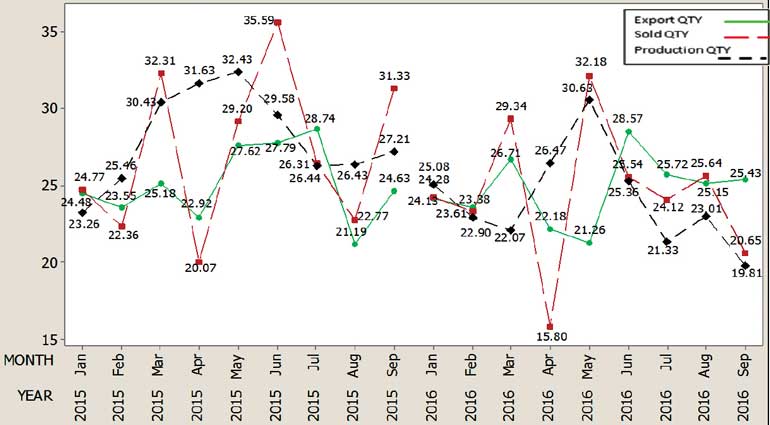
The total Sri Lanka tea production for January-September 2016 recorded 218.6 M Kgs in comparison to 252.9 M Kgs (-34.3 M Kgs) for the same period last year. Production has declined by 34.3 M Kgs and exports have decreased by 3.34 M Kgs compared to the same period in 2015.
The Total National Average of the Teas sold for January- September 2016 was Rs.442.08 in comparison to Rs. 401.08 (+ Rs. 41.00) for the same period last year. Low Growns averaged Rs.457.94, Mid Growns recorded Rs.400.07 with High Growns at Rs.426.83.
The rupee equivalent averages for Low Grown, Medium grown and high grown shows an increase in comparison to the same period in year 2015. The US$ equivalent averages shows an increase on the corresponding average when compared to year 2015. However it’s lower to 2014. High Growns having a market share of 22% of the production recorded the sharpest increase of Rs.+43.22 with Mid Growns recording an increase of Rs.37.95 whilst low Growns recorded an increase of Rs.+41.24 when compared to 2015.
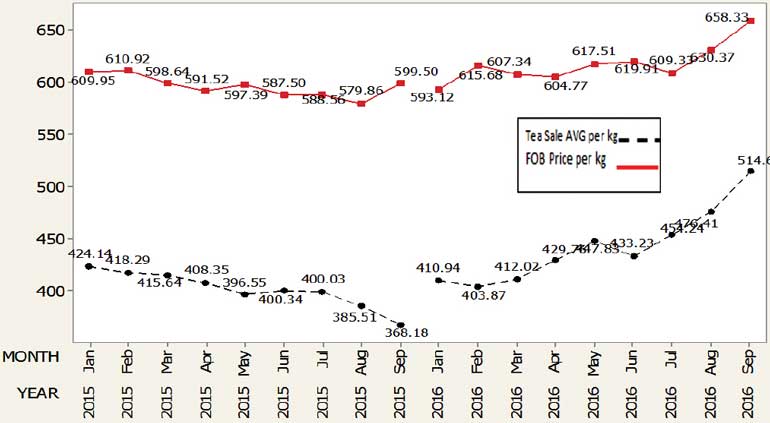
Sri Lanka tea exports January- September 2016 amounted to 222.75 M Kgs vis-à-vis 226.10 M Kgs recorded for the same period last year (-3.34 M Kgs). The FOB average price per kilo for this period stood at Rs.617.66 vis-à-vis 595.95 (+21.71) for the same period last year.
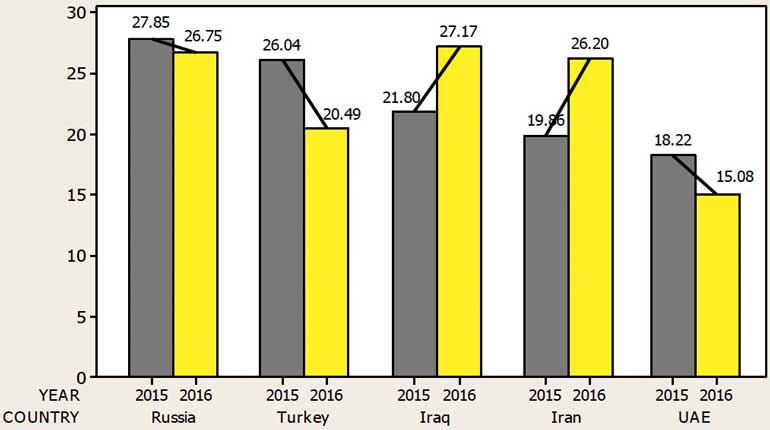
The total revenue realised for January- September 2016 from tea exports was Rs.137.58 billion ($ 0.942 b) compared with Rs. 134.74 billion ($ 0.991 b) (+Rs. 2.84 billion) recorded last year. It was an increase in rupee value but lower in dollar value. Iraq has emerged as the largest buyer of Sri Lankan tea in the period of January-September 2016. Iran has shown a considerable increase in their purchase volume from Sri Lanka. Turkey the second largest importer of Sri Lanka tea in 2015 has shown a significant decline in their purchases and moved down to the fourth position.
Probable trends for 2017
Russia – Although the recession continues in Russia the pace of decline of GDP has slowed down. Russia continues its adoption for lower oil prices and to the environment of economic sanctions imposed in July 2014. The fall in real incomes has kept the domestic demand depressed. However, the economic indicators are now picking up. Inflation in January-October 2016 was 7.4% less than half of 15.9% for the same period in 2015. With the new US President elected there is a possibility of sanctions against Moscow could be curbed.
Turkey – Local tea imports to Turkey have seen a sharp decline this year. Heavy fighting in the Turkey and Syria border, and increased border checks may have blocked smuggling routes to the neighbouring destinations.
Iraq – Iraq economy is expected to grow by 4.8% in 2016 due to increase in oil production. The medium term outlook seems favourable with important gains against ISIS. Iraq is the third largest crude oil exporter in the world with $ 52.5 billion worth oil exports in 2015.
Iran – Sri Lanka tea exports to Iran have increased in the third quarter of 2016. Iran’s GDP is expected to grow 4.6% in 2016. Parliamentary and assembly of experts’ election saw a major gain for the moderates over the prominent conservatives which depicted the public support for reform minded government. The current account is projected to turn into a surplus in 2017 with rising oil exports.
UAE – The economy is expected to a slow recovery of 2.5% between 2016 and 2018. Since 2014 UAE has been affected with plummeting global oil prices and a drop in hydrocarbon export revenue. Sri Lankan tea exports to UAE have decreased in the third quarter.
Emerging and potential markets – China seems to be increasing its purchases from Sri Lanka. USA, Netherlands, Germany and Belgium have purchased higher volumes of Ceylon tea this year.
Global economic forecast
In the first half of 2017 global economy is expected to strength with an average projection of 2.8% growth for the period. A recovery in global trade and commodity prices is expected to boost emerging economies.
Donald Trump’s policy platforms, market reactions to it could have volatility in the financial Markets. The Global economy is expected to strengthen by 2.9% in 2017.
Global outlook for 2017 reflects unchanged growth prospects for Europe area, Japan and United States. The economic outlook for Mena region (Middle East and North Africa) for 2017 is projected at 2.8%, weak global growth, geopolitical risks, low oil prices continued to jeopardise the region’s economic recovery. Iran is expected to be the best performer in 2016.
US Dollar – The US Federal Reserve announced a 0.25% increase in the benchmark rate on 16th December 2016 and predicted three further rate increases in 2017. This could depreciate the rupee further against the US Dollar. The Sri Lanka Rupee has depreciated 2.5 % against the US Dollar this year.
OPEC and oil outlook
The 2017 forecast for a barrel of oil is at $55.95 the members of the OPEC prepare to limit production after a long period of time. The OPEC countries agreed to cut output by 1.2 million barrels per day more than 1% global output. The non OPEC members will join in with a 600,000 barrel a day cut with Russia accounting for around half of the total. World oil stockpiles continued to accumulate as demand faltered from China and India in 2016, and record output from OPEC Gulf members, shale oil producers being able to cut costs and being able to operate at low price levels have also affected the global oil prices.
Chinese economy and commodity prices
The Chinese economy expanded in the third quarter. GDP expanded at an annualised 6.7%. There was a marginal decrease in industrial output in the third quarter. However, retail sales grew at an annualised 10.7%. Chinese demand for commodities has seen a growth in 2016.
Sri Lanka, whilst being a top category tea exporter in the world, it’s imperative to look into taste preferences, consumer habits in our export destinations as well as in the markets to be explored in order to expand revenue from exports. Therefore, it would be prudent to look at the global beverage market in order to maximise our export potential.
The non-alcoholic beverage market is expected to reach $ 1937.73 b by year 2020 (Transparency Market Research) whilst the soft drinks are the largest product segment, tea and coffee is expected to be the fastest growing market. Coca-Cola is the single largest brand in the non-alcoholic beverage market with an annual turnover of $ 43 b. The global tea beverage market is expected to be around 38.2 b in retail value in 2016.
The Asian beverage markets (Emerging Markets) is expected to experience unprecedented growth taking two thirds of the global incremental consumption by 2021, while China alone would be one-third of the additional volume and Middle East and North Africa (Mena) are anticipated to have a significant increase.
Whilst Sri Lanka’s annual tea export value is around $ 1.3 b, and with the decline of tea production YOY it seems unlikely that the industry could increase its revenue by exporting tea as a mere commodity.
Whilst the industry is more focused on finding solutions to the efficiency gap, it is important to look at the opportunity gap in the expanding global beverage market.
The 4.4 b populated (7.4 b global) Asia region is a market awaiting to be explored, converting non consumers into consumers, reverse innovation, value addition are methods that could be adopted to harness the full potential of this market.
It is important to pay heed to the weak signals (changes of technology, competition) that are emanating from the industry. Preparation for future competition, allocating resources accordingly and creating next practices are prudent for the viability and growth of the industry.


