Friday Apr 03, 2026
Friday Apr 03, 2026
Thursday, 23 August 2018 00:00 - - {{hitsCtrl.values.hits}}
By Ceylon Tea
Broker Plc
The second quarter of the Sri Lankan tea industry in 2018 saw a sharp decline in elevation averages in comparison to the first quarter.
Increased crop figures and decline in quality, political tension in the Middle East, contributed towards the downward spiral of prices in quarter two. Whilst the global tea supply increased in the first half of 2018, Sri Lankan tea exports remained static in comparison to the same period last year.
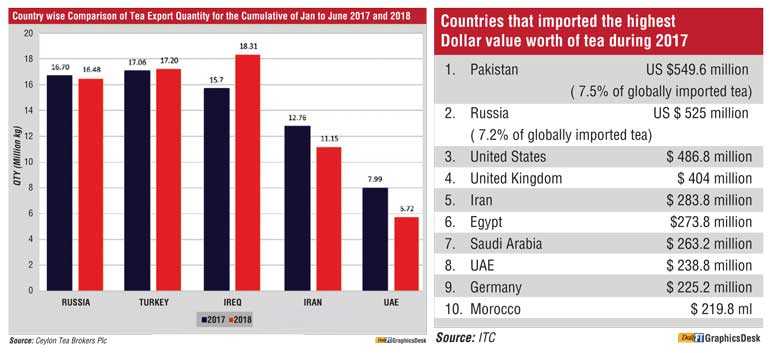
Iraq, Turkey and Russia continued with strong demand for Sri Lankan tea and were the top three importers in the first six months concluded.
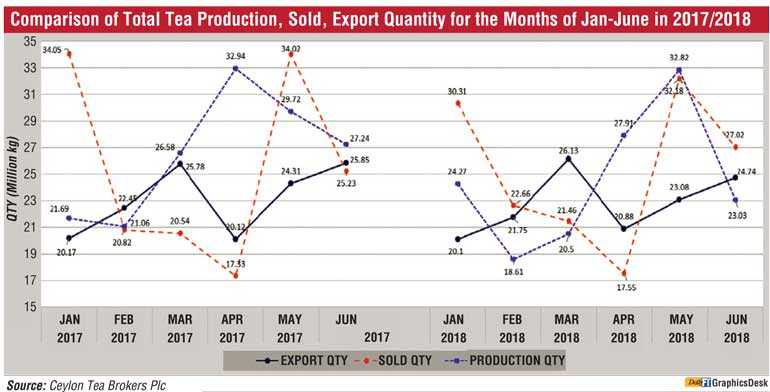
The total Sri Lanka tea production for January-June 2018 recorded 158.21 M Kgs in comparison to 156.78 M Kgs (+1.43 M Kgs) for the same period last year. Production has increased by 1.43 M Kgs and exports have decreased by 1.1 M Kgs compared to the same period in 2017.
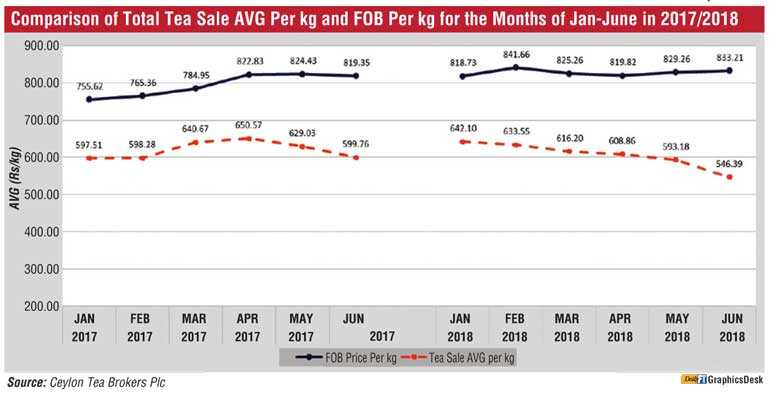
The total national average of the teas sold for January-June 2018 was Rs.603.52 in comparison to Rs 615.32 (- Rs 11.8) for the same period last year. Low Growns averaged Rs.628.17, Mid Growns recorded Rs.543.10 with High Growns at Rs.575.44.
The averages for High, Medium and Low Growns in rupee and dollar terms, shows a decrease for the period January-June 2018 when compared to the same period in 2017 but its higher compared to 2016, 2015 and 2014. Low Growns with the largest market share with 61.8% of the production recorded a decrease of (-Rs. 8.31) with the High Growns recording a decline of (-Rs. 12.85) whilst the Medium Growns decreased by (-Rs. 29.63) when compared to year 2017.
Sri Lanka tea exports for January-June 2018 amounted to 137.59 M Kgs vis-à-vis 138.69 M Kgs recorded for the same period last year (-1.1 M Kgs). The FOB average price per Kilo for this period stood at Rs. 828.13 as against Rs. 796.34 recorded for the same period last year. (+Rs. 31.79)
The total revenue realised for the period January-June 2018 from tea exports was Rs. 114.0 billion ($ 751.28m) compared with Rs. 110.4 billion ($ 728.23) (+Rs 3.6 billion) recorded last year. It’s an increase in rupee and dollar value compared to the year 2017.
Iraq has emerged as the largest buyer of Sri Lankan tea in the period of January-June 2018 outplacing Turkey. Russia and Iran records as the third and fourth largest importers of Sri Lankan tea for the mentioned period.
The global economic overview
The world’s economic growth remained robust in Q1. Meanwhile economic data for Q2 suggests that global growth will decelerate slightly in Q2 as the driving factors that have propelled worldwide economic growth since 2016 start to wane.
In the Euro area ongoing political unrest continues to weigh on growth, with political crisis in Italy and Spain. The UK economy is suffering from uncertainly related to Brexit. United States represents the Silver lining with the economy firing all cylinders. The global growth is expected to ease slightly to 3.4% in Q2.
Russian economy
On 22June Russia and OPEC members agreed to raise oil production a move that would bode well for Russia’s oil revenue going forward. Low employment rising real wages and firm commodity prices should fuel quicker growth this year.
Iran economy
The US continues to put pressure on Iran’s trading partners to cut their imports from the Persian country. The United States is urging countries to reduce oil imports from Iran to Zero by November 4th. Moreover, United States will not grant any waivers for countries or companies doing business with Iran. If the US succeeds in dramatically cutting much needed oil revenues, it will badly hit the Iranian economy. Iran economy is expected to grow 2.8% in SH 2018. The Iranian Rial has devalued 40% against the US Dollar since May and trades at around 90,000 to a dollar.
The Middle East and North Africa (MENA)
The regional economy gained steam at the outset of the year as a higher oil prices and steady production boosted economic growth.
Chinese economy
The brewing full blown trade war between China and United States is the main downside risk to China’s economic outlook. The economy is seen to grow 6.5% in 2018.
Crude oil
Brent crude oil recorded an average of $ 74.4 per barrel in June 2018 as against $46.37 per barrel in 2017. (Brent crude is the world’s leading crude bench mark for Atlantic basin. It is used to price two-thirds of the international traded crude oil supplies.)
US Dollar
The US Dollar has strengthened in Q2 against the basket of other currencies. The US Federal Reserve is likely to hike interest rates twice more this year. The US Dollar hit a 13-month high against a basket of currencies in the month of August.
Countries that imported the highest dollar value worth of tea during 2017
1. Pakistan $549.6 million (7.5% of globally imported tea)
2. Russia $ 525 million (7.2% of globally imported tea)
3. United States $ 486.8 million
4. United Kingdom $ 404 million
5. Iran $ 283.8 million
6. Egypt $273.8 million
7. Saudi Arabia $ 263.2 million
8. UAE $ 238.8 million
9. Germany $ 225.2 million
10. Morocco $ 219.8 ml
(Source: ITC)
Global purchases of imported tea totalled $ 7.3 billion in 2017. Overall, the value for imported tea for all buyer countries fell by an average 0.5% since 2013.
Asian countries accounted for the highest dollar worth of tea imported during 2017 with purchases valued at $ 3.1 billion or 42.3% of the global total. European countries were at 30.3% while 14.7 % of the worldwide tea imports were from Africa.
Major tea producing countries are currently witnessing healthy production levels. Whilst, seasonally prices are expected to move up on the short term in the next few months due anticipated demand from the European sector, US sanctions against Iran and impending sanctions against Turkey and Russia, political tension in the Middle East could have adverse effect on the price structure of the tea industry.

