Saturday Mar 14, 2026
Saturday Mar 14, 2026
Thursday, 27 February 2020 00:00 - - {{hitsCtrl.values.hits}}
By Ceylon Tea Brokers PLC
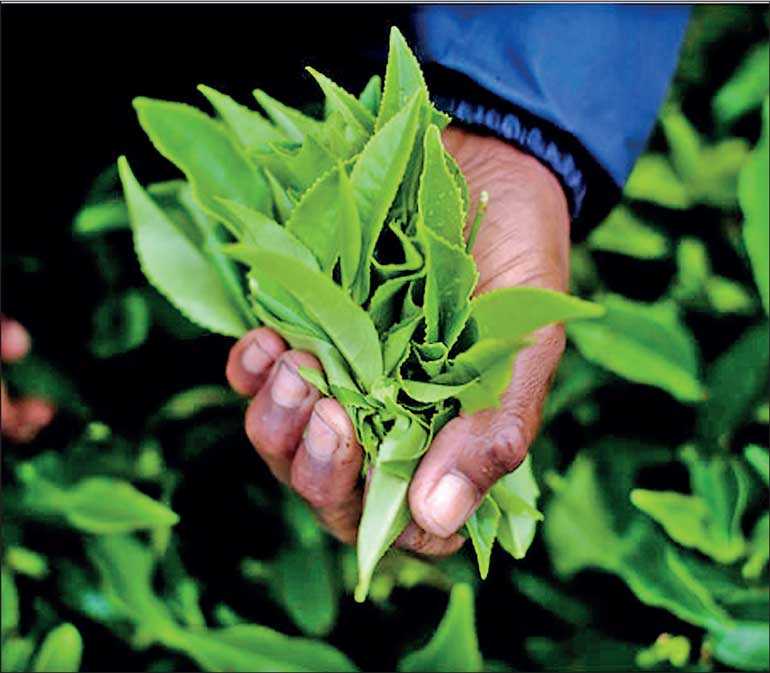
Sri Lanka tea industry witnessed a “mediocre” year with decline in production, averages and a growth in exports in comparison to year 2018. The industry’s export revenue depicted a growth from year 2018 backed by a weakened rupee. The macroeconomic factors continued to fundamentally challenge the tea industry framework with fluctuations in supply and demand, currencies, political climate in importing countries, policy decisions severely affecting the industry.
Climate change which had a severe impact globally is a factor the industry needs to consider, a decisive factor in agriculture and crop production.
The total tea production of Sri Lankan Tea for the year 2019 recorded 300.13 million kg in comparison to 303.94 million kg for the same period in 2018 (-3.81 million kg). High and Low Growns shows a decline in volume in comparison to 2018 whilst Medium Grown shows a marginal increase.
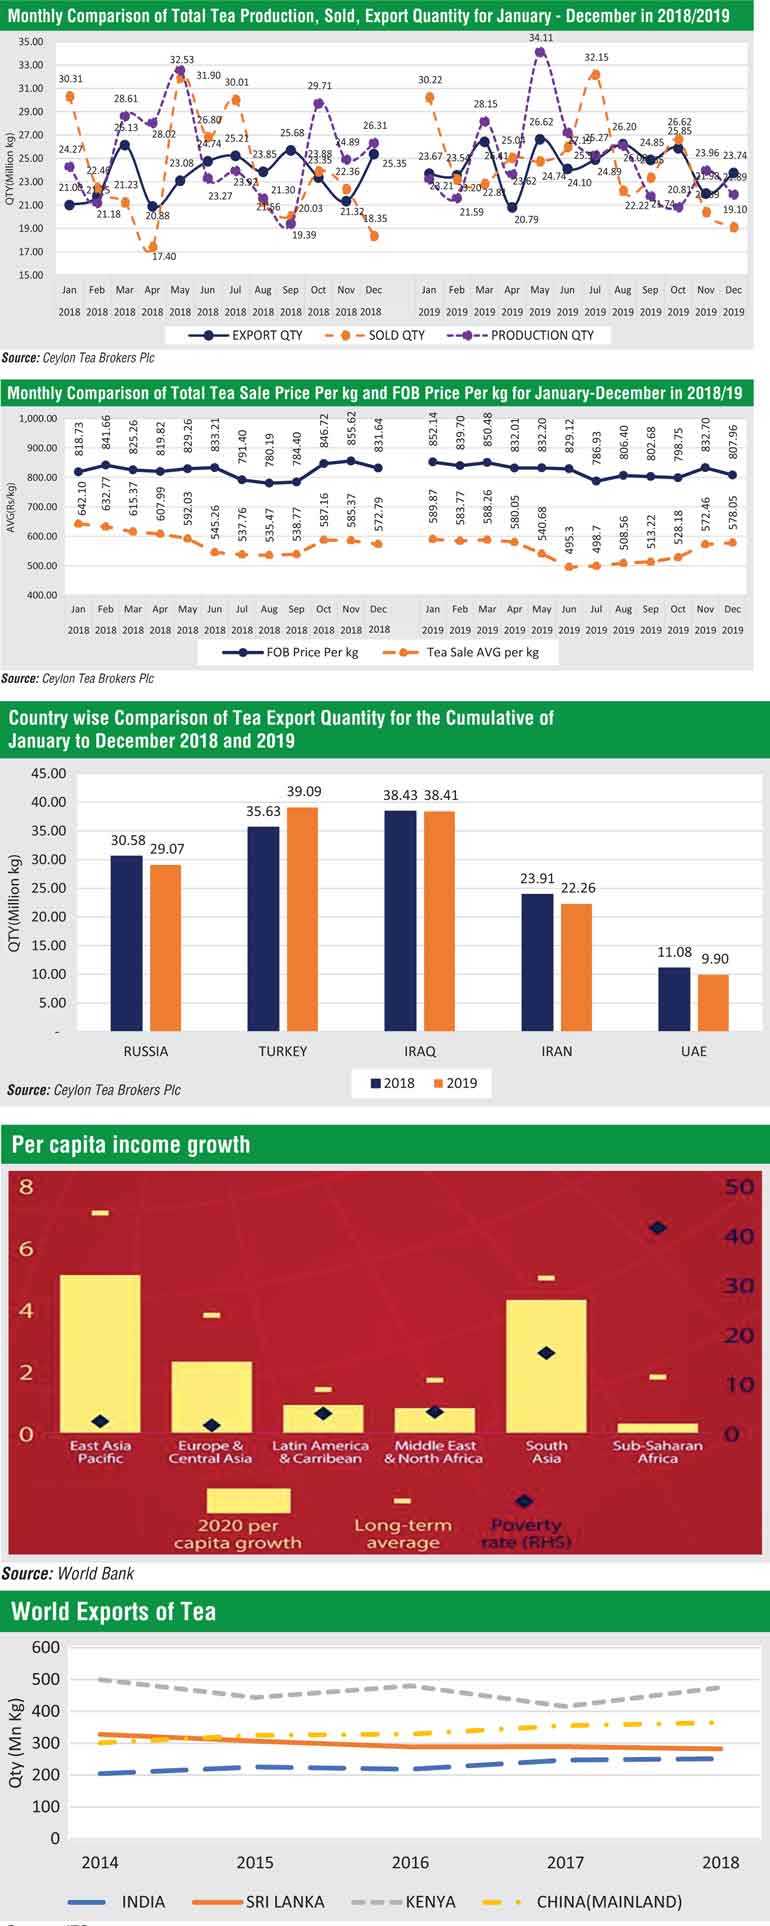
The CTC High, Medium and Low Grown shows a decline in volume when compared to the year 2018. Though Production decreased by -3.81 million Kgs, Exports has increased by +10.29 million kg compared to the same period in 2018. Sri Lanka’s production as a percentage share of world production has declined to 5.2 % in 2018 from 7.2 % in 2009. The total National Average of Teas sold for the year 2019 was Rs. 544.54 ($ 3.05) per kilo in comparison to Rs. 581.91 ($ 3.58) (-Rs. 37.37) for the same period in 2018. Low Growns averaged Rs. 576.61 (US $3.23); Mid Growns recorded Rs. 468.96 (US $2.62) with High Growns at Rs. 508.63 ($ 2.85).
The averages for High, Medium and Low Growns in rupee and dollar terms, shows a decrease for the period January-December 2019 when compared to the same period in year 2018. Low Growns with the largest market share with 63.3% of the production recorded a decrease of (-Rs. 24.18), High and Medium Growns recorded a decrease of (-Rs. 62.88) and (-Rs. 52.90) respectively when compared to the corresponding period in the year 2018.
Sri Lanka Tea Exports for the period January-December 2019 amounted to 292.66 million kg vis-à-vis 282.36 million kg recorded for the same period last year (+10.29 million kg). The FOB average price per kilo for this period stood at Rs. 822.25 in contrast to Rs. 820.75 (Rs. +1.5) when compared to year 2018.
The FOB value of Tea Bags has moved up in comparison to the same period in 2018. The total revenue realised for the period January-December from Tea Exports was Rs. 240.64 billion ($ 1.35 billion) compared with Rs. 231.75 billion ($ 1.43 billion) recorded in the year 2018. It’s an increase in rupee terms (+Rs. 8.9 billion) and a decrease in dollar value (-$ 0.08 billion) compared to the year 2018. Teas in Packets and Bulk showed a decrease in FOB Value YOY.
Country wise analysis of exports shows that the Turkey emerged as the largest importer of Sri Lanka tea for the period of January-December 2019 followed by Iraq and Russia. However, tea exports to Iraq, Russia and Iran have dropped by (-0.03) Mn/Kg (0.07%), (-1.51) Mn/Kg (-4.95%), (-1.65) Mn/Kg (-6.90%) respectively compared to the previous year whilst tea exports to Turkey has increased by 3.45 Mn/Kg (+9.69%). Tea exports to other CIS countries have increased by (+1.42) Mn/Kg. Libya has decreased by (-1.36) Mn/Kg whilst China and Syria has increased by (+1.85) Mn/Kg, (+0.81) Mn/Kg respectively.
In terms of the dollar equivalent, based on the respective weighted average exchange rates, export earnings amounted to $ 1.35 billion in 2019 in comparison to $ 1.43 billion in 2018 with $ 1.53 billion in 2017, $ 1.27 billion in 2016, $ 1.34 billion in 2015 and $ 1.63 billion in 2014. Export value in rupee terms in 2019 records as the highest with Rs. 240.63 billion in revenue.
World economic outlook
Global growth is projected to rise from an estimated 2.9 % in 2019 to 3.3 % in 2020 and 3.4 % for 2021. The downward revision primarily reflects negative surprises to economic activity in few emerging market economies. Favourable news on US-China trade negotiations, and diminished fears of a no-deal Brexit, leads to some retreat from the risk environment.
The outbreak of Coronavirus will weigh on global economic growth this year as the effects of controlling the disease spill from China into the rest of the world. Majority of the damage is bound to happen in the first quarter.
East Asia and Pacific
Growth in the region is projected to ease to 5.7 % in 2020. Reflecting a further moderate slowdown in China to 5.9 % this year amid continued domestic and external headwinds.
Europe and Central Asia
Regional growth is expected to firm to 2.6% in 2020, Euro Area growth and recovery in Turkey (to 3%) and Russia (to 1.6%) is to hold in good stead. Economies in Central Europe are anticipated to slow to 3.4%.
Middle East and North Africa
Regional growth is projected to accelerate to 2.4 % in 2020 largely on higher investments and stronger business climates among oil exporters. Growth is expected to pick up to 2%. Iran’s economy is expected to stabilise after a contractionary year.
South Asia
Growth in the region is expected to rise to 5.5 % in 2020. Economic activity would benefit from policy accommodation in India and Sri Lanka and support from infrastructure investments in Afghanistan, Bangladesh and Pakistan.
North America
US Economic outlook is healthy according to the economic indicators. The GDP Growth rate is expected to fall below 3%. Unemployment rate forecast is to continue below the natural rate.
China
China may cut its economic growth expectations for 2020 as the deadly Coronavirus outbreak intensifies. Economists’ forecasts that China GDP rate would sink to 4.5 % in the first quarter of 2020.
Dollar
Dollar exchange rates have further strengthened after the Federal Reserve implied interest rates would stay unchanged in the near future. Policymakers agreed to maintain rates between 1.5 % to 1.75 % on a strong economy.
Oil prices
Oil prices in 2020 is expected to recover from late 2019 levels as demand regains. It is forecasted for 2020 that Brent Crude Oil would average $ 70 billion.
Per Capita income growth lags behind long term averages
A worrying aspect of the global growth trend is, even if the recovery and emerging and developing economy growth takes place as expected, per capita growth will remain below long term averages.
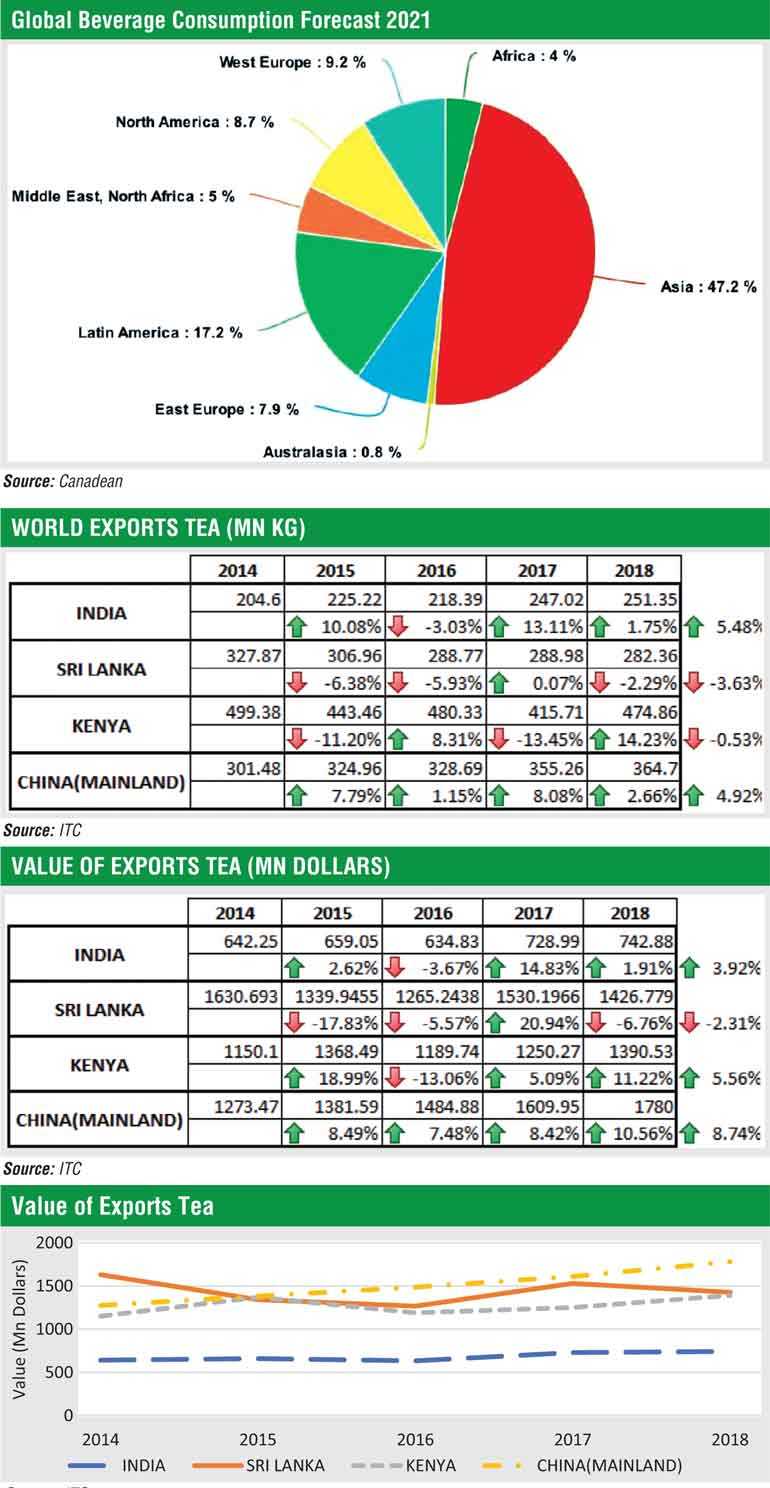
Asia will account for two-thirds of global incremental beverage consumption by 2021, with China alone responsible for one-third of additional volume. Latin America is expected to achieve the second highest incremental volume growth behind Asia.
Sri Lanka’s exports
Sri Lanka’s Tea Export volume has cumulatively declined -3.63 % for the period of 2014-2018.
Sri Lanka Tea Export value has declined cumulatively -2.31 % for the period of 2014-2018 whilst the other major exporting countries namely Kenya, China and India has increased in value.
On analysing the above Sri Lanka has gradually lost out on Export volume and value over the years. Sri Lanka’s Export volume as a percentage share of world exports has declined to 14.7 % in 2018 from 17.3% in 2009. Sri Lanka tea export value has declined cumulatively.
This indicates that protectionism would not boost the industry’s competitiveness and globalisation is an important factor to be considered with respect to the future of the Tea Industry. In the new system of globalisation in which walls between countries, markets and disciplines are increasingly being blown away-constitutes a new state of being which needs to be considered. The Sri Lanka Tea Production inched its way over the 300 million mark in 2019, after a volatile end to 2019. The year 2020 could be looked at on a more positive note. The world economy is poised for a modest rebound this year.
In the year 2019 the world economic growth being the slowest since global financial crisis, the growth in 2020 could be stronger if reduced trade tensions could mitigate uncertainty, a decline in downturns in major economies, reduced financial disruptions would pave the way for a healthier year. Therefore, a reasonable level of optimism should prevail if all factors affecting growth are reasonably stable.


