Friday Jul 03, 2026
Friday Jul 03, 2026
Wednesday, 7 February 2018 00:00 - - {{hitsCtrl.values.hits}}
 By Ceylon Tea Brokers Plc
The Sri Lankan tea industry witnessed a favourable year with an increase in production, and averages reached all-time high levels which was portentous to the industry. Though the export volumes witnessed a static growth when compared to the previous year, export revenue established an all time record high in rupee terms. Despite the ascent witnessed in the concluded year the industry continued to be plagued with geo political tension in the tea importing countries, policy decisions which affected the production of tea and temperature variability due to climate change are factors that may lag industry growth.
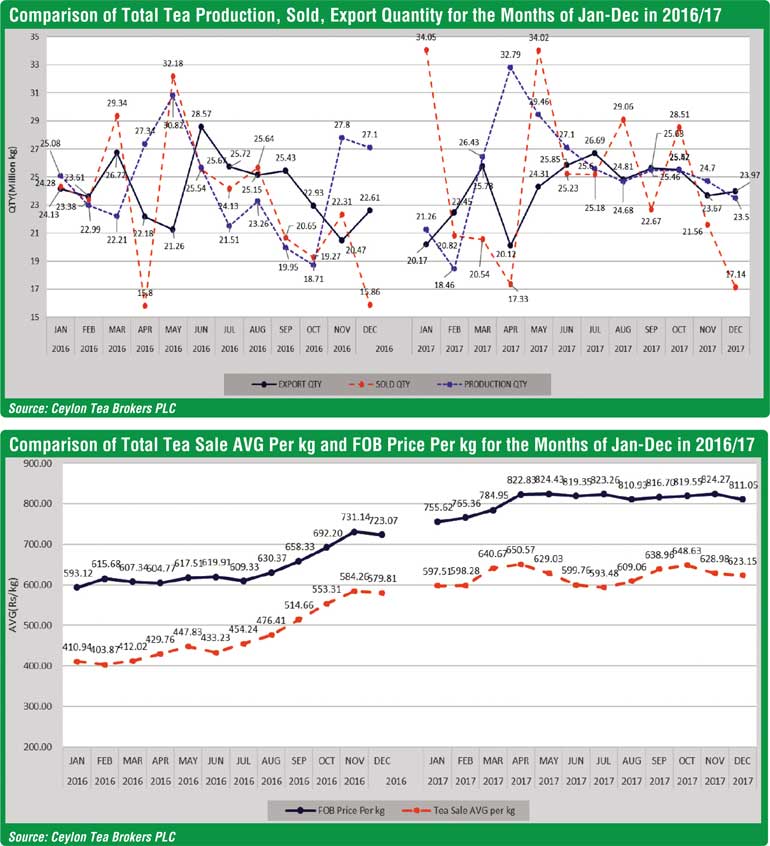
The total tea production of Sri Lankan tea for the year 2017 recorded 307.08 million kg in comparison to 292.57 million kg for the same period in 2016 (+14.51 million kilos). Though production increased by 14.5 million kilos, exports have increased only by 0.21 million kilos compared to the same period in 2016.
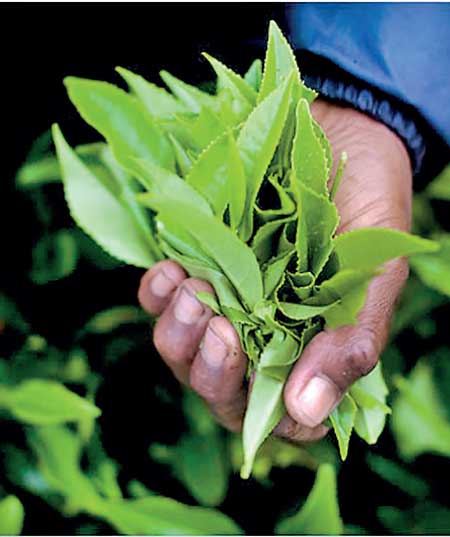
The total National Average of Teas sold for the year 2017 was Rs. 618.14 ($ 4.04) per kilo in comparison to Rs. 468.61 ($ 3.14) (+Rs. 149.53) for the same period in 2016. Low Growns having the largest market share with 64% of the production recorded the sharpest increase at (Rs. +150.66) with Mid Growns recording an increase of (Rs. +143.95) and High Growns recording an increase of (+Rs. 151.08) when compared to 2016.
Low Growns averaged Rs. 637.40, Mid Growns recorded Rs. 563.54 with High Growns at Rs. 600.93 for the cumulative period of January to December 2017.
Auction averages January/December 2017 which realised Rs. 618.14 records as the highest ever yearly auction average superseding Rs. 468.61 achieved in 2016. High, medium and low grown averages recorded for the year 2017 are also the highest ever recorded. Further these averages also record as the highest in US Dollar terms compared to previous years.
Sri Lankan Tea Exports for the period January to December 2017 amounted to 288.98 million kilos. An increase of 0.21 million kilos compared with the same period last year. The FOB average price per kilo for this period stood at Rs. 807.44 in contrast to Rs. 639.88 (Rs.+ 167.56) when compared to year 2016. The FOB value of Tea Bags has moved up in comparison to the same period in 2016. The FOB value in Tea Bags recorded Rs. 1,321.19 per kg for the year 2017 vis-à-vis Rs. 1,191.55 per kg in 2016 (+129.64). Its export volumes show a marginal increase. Tea in bulk and packets saw a substantial price increase YOY.
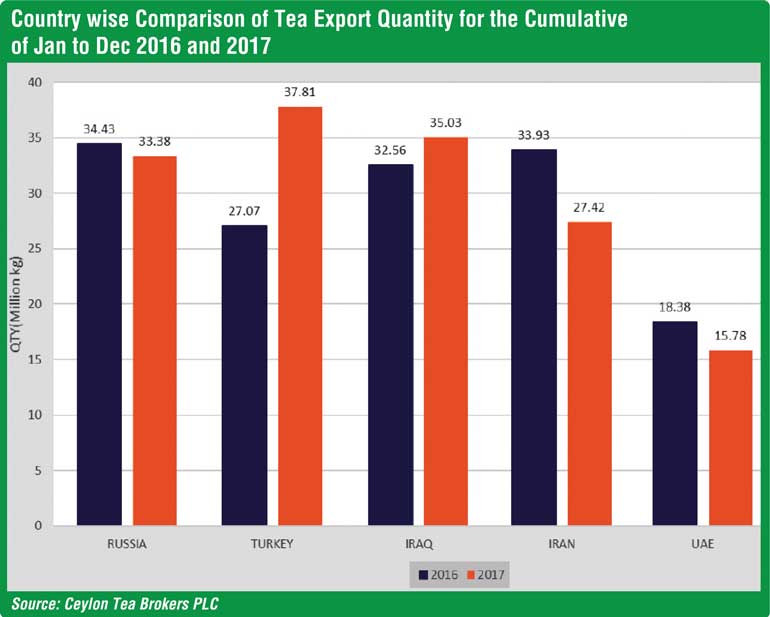
Country wise analysis of exports shows that the Turkey remains as the largest importer of Sri Lanka tea for the period of January-December 2017 followed by Iraq and Russia. More importantly, cumulative tea exports to Vietnam (+207%), Taiwan (+40%), Turkey (+40%), China (+30%) and UK (+23%) have increased significantly whilst Syria (-39%), Kuwait (-31%), Iran (-19%), Ukrain (-17%) and U.A.E (-14%) have shown a noticeable decline as against the corresponding period in 2016. The sharp increase in imports by Vietnam probably points out to a tea hub being operated there.
In terms of the US$ equivalent, based on the respective weighted average exchange rates, export earnings amounted to $ 1.53 billion in 2017 in comparison to $ 1.26 billion in 2016, with $ 1.34 billion in 2015 and $ 1.63 billion in 2014. The cumulative Rupee earnings recorded an All Time high with 233.34 billion as against previous best of Rs. 212.91 in 2014.
Global economic overview
The global economic growth reached 3%, the biggest growth rate since 2011. The growth is expected to remain steady in 2018. The global economy is expected to edge up to 3.1% in 2018 after much stronger than expected 2017. Growth in advance economies are expected to gain 2.2% in 2018 and growth in emerging markets and developing economies are projected to strengthen 4.5% according to the World Bank.
East Asia and Pacific
The growth in the region is expected to slip to 6.2% in 2018 from 6.4% in 2017. Stronger than expected growth among advanced economies could lead to faster than anticipated growth in the region. Growth in China is forecasted at 6.4% in 2018.
Europe and Central Asia
Growth in the region is anticipated at 2.9% in 2018. Russia is expected to expand 1.7% in 2018 unchanged from the growth rate in 2017. Turkey is projected to moderate to 3.5% this year from 6.7% in 2017.
Middle East and North Africa
Growth in the region is expected to jump to 3% in 2018 from 1.8% in 2017. Reforms across the region are expected to gain momentum. Continued geopolitical conflicts and oil price weaknesses could setback economic growth.
South Asia
Growth in the region is forecasted to accelerate to 6.9% in 2018. Consumption is expected to stay strong and exports are anticipated to recover.
Oil
The Brent Crude oil average forecast for the year 2018 is at $ 59.88 per barrel. Analysts see global economic growth supporting high oil demand in 2018 and expectations of strong OPEC and allies’ commitment to the production cuts are expected to support oil prices this year. Oil prices hit a 30 month high in December 2017.
US Dollar
In the year 2017, the US Dollar recorded an annual decline for the first time in five years. The ICE Dollar Index which measures the dollar against a basket of six other currencies fell nearly 10% in 2017, being the biggest annual decline since 2003. A big part of the dollar’s decline in 2017 was due to the Euro’s strength. The Eurozone had the best economic year in a decade. It is predicted that the US Dollar will continue to decline in 2018 due to expected pick up in global growth and outflows of capital from the US due to strengthening of the rest of the world. The US Federal reserve projects three interest rates hikes in 2018.
China and commodities
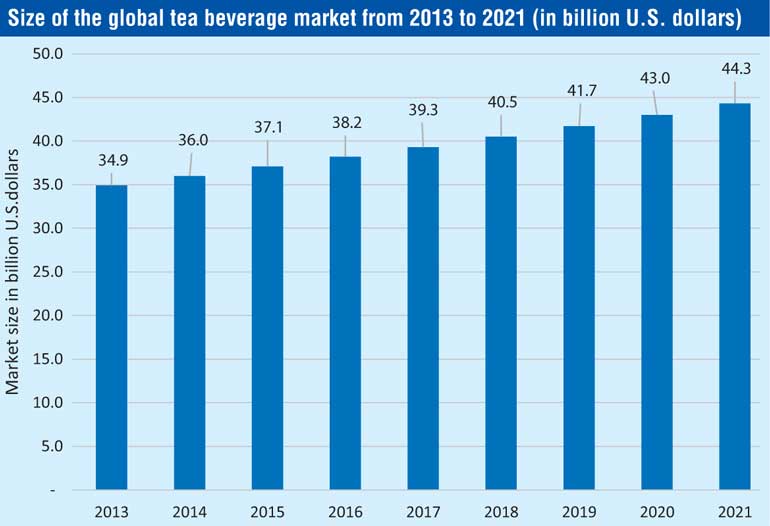
Commodity gains will be sustained through 2018 lifted by emerging markets as well as advanced economies. A slowdown in China for commodities is expected. However, as the consumer of about half of the world’s raw materials, China will remain to be the biggest influencer of commodity markets in 2018. Tea is the 415th most traded product according to the product complexity index. The global Tea beverage market in 2021 is estimated to be $ 44.3 billon. In the United States the wholesale tea sales generated approximately 11.5 billion US$ in 2015, of that approximately 5.56 billion US $ in sales was generated from ready to drink tea varieties.
Whilst the Sri Lanka tea production inched its way back to 307 million kg up from 292.4 million kg for the year 2016 (lowest since 2009, 289.7 million kg), the year 2018 looks positive for the industry. The global economy is expected to remain resilient this year whilst the oil prices should hold strong due to the OPEC led production cut. Therefore, optimism should prevail given the above; however GEO political instability in the Middle East and globally could affect the industries onward movement.


