Saturday Aug 01, 2026
Saturday Aug 01, 2026
Friday, 1 June 2018 00:00 - - {{hitsCtrl.values.hits}}

 By Ceylon Tea Brokers Plc
The 1st quarter of the Sri Lankan Tea industry saw an upward momentum with elevation averages superseding the comparative period in 2017. Tea production saw an increase in the period of review whilst exports witnessed a marginal gain.
The oil sector posted gains during the first quarter of 2018 which would contribute towards the economic wellbeing of our major tea importing countries.
However, USA’s decision to abandon the nuclear deal with Iran is anticipated to be a major setback for the industry.
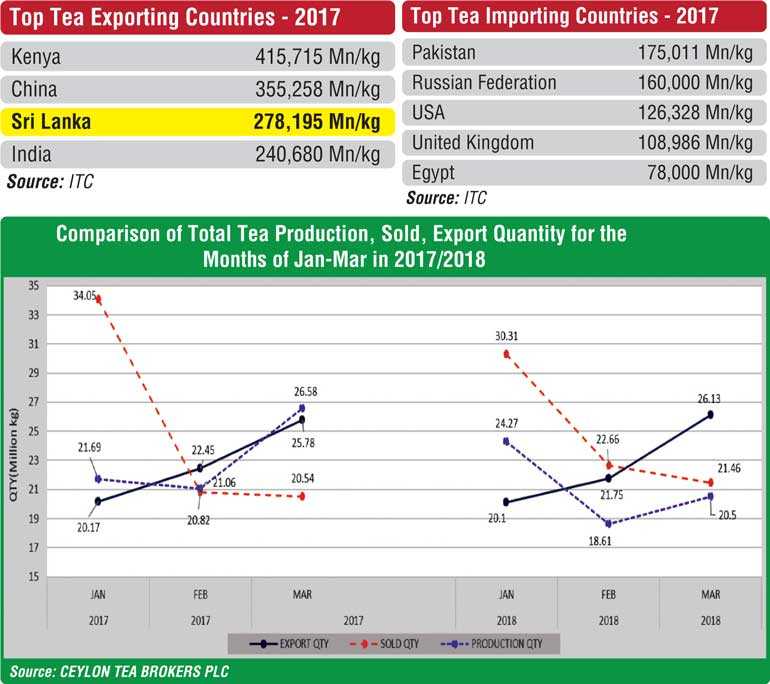
The Total Sri Lanka Tea Production for First Quarter 2018 recorded 74.23 M kg in comparison to 66.88 M kg (+7.35 M kg) for the same period last year.
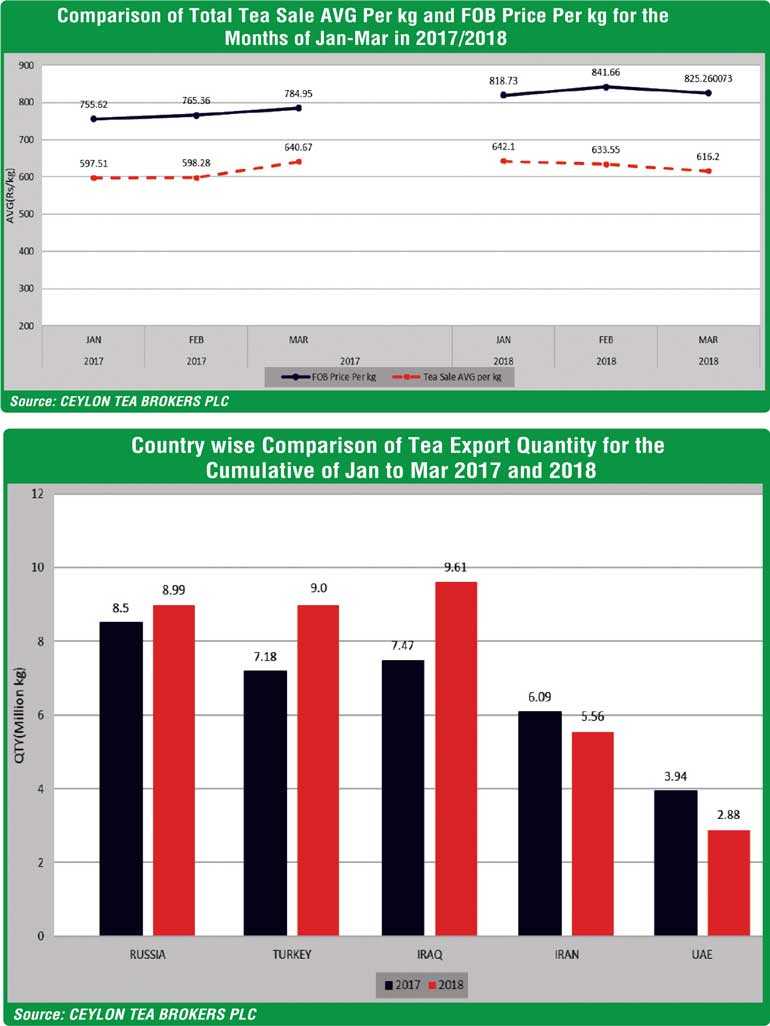
The Total National Average of the Teas sold for the first quarter of the year 2018 was Rs. 629.77 in comparison to Rs. 608.03 (+ Rs. 21.74) for the same period last year. Low Growns averaged Rs. 643.90, Mid Growns recorded Rs. 571.86 with High Growns at Rs. 628.04. The averages for High, Medium and Low growns in Rupee terms shows an increase in the first quarter 2018 when compared to years 2017, 2016 and 2015. Low growns having the largest market share with 63% of the production recorded the sharpest increase of Rs. 29.08 with the High growns recording an increase of Rs. 8.42 whilst the Medium growns increased by Rs. 7.58 when compared to year 2017.
Sri Lanka Tea Exports for the first quarter of 2018 amounted to 68.89 M kg vis-à-vis 68.04 M kg recorded for the same period last year (+0.85 M kg). The FOB average price per kilo for this period stood at Rs. 828.45 as against Rs. 769.87 recorded for the same period last year. (+Rs. 58.58)
The total revenue realised for the first quarter 2018 from Tea exports was Rs. 57.07 billion (349.17m US$) compared with Rs. 52.66 billion (311.85m US$) (+Rs 4.41 billion) recorded last year. It’s an increase in Rupee and Dollar value compared to the year 2017.
Iraq has emerged as the largest buyer of Sri Lankan tea in the first quarter of 2018. Turkey has shown a considerable increase in their purchase volumes from Sri Lanka.
Global Economic Overview
The Global Economy expanded 3.5% in quarter 1, matching quarter 4 in 2017. Accommodative financial conditions, resilient private consumption were main factors behind quarter 1s robust growth. Meanwhile China continues to defy any sign of economic slowdown with services and private consumption taking the helm of economic growth. Growth in the Eurozone has weakened in the 1st quarter with the decline of industrial production.
Russian Economy picked up in the first quarter of 2018. Russia’s economic recovery continues, amidst relatively high oil prices, enhanced macro-economic stability and gradual monetary loosening. The economy is expected to expand 1.7% in 2018. This summer’s football world cup in Russia is expected to impact the economy by $ 31 billion.
The Middle East and North Africa (MENA) regional economy appears to have gained steam at the outset of this year mainly due to higher oil prices, strong external demand and stabilisation policies and reforms in some countries. MENA economy expanded 2.7% in the first quarter. Egypt’s economy has stabilised following the implementation of IMF backed measures and Qatar further opening its economy and Saudi Arabia unveiling a privatisation roadmap to reduce its reliance on its gigantic state sector. Egypt’s economy is expected to be a top performer in 2018 followed by Iran.
Iran Economy remains strong on the back of resilient oil export growth amidst higher prices for the commodity. However, a 15% slide in the Rial against the US Dollar worsened, disrupting economic activity and added upward pressure on inflation.
Global inflation inched down from February’s 10 month high of 2.8% to 2.7% in March 2018.
Crude Oil – The prices of Brent Crude Oil averaged $67 per barrel in the first quarter of 2018 as against $54 in the same period last year.
US Dollar – The US Dollar index weakened 2.7% against a basket of foreign currencies in the 1st quarter of 2018. The US Federal reserve forecasts two more rate hikes this year.
Iran Nuclear deal – The US unilaterally pulled out from Iran nuclear deal. The Iran nuclear deal was reached in 2015 between Iran and a group of world powers namely US, UK, Russia, France, China and Germany. The US has threatened to re-impose sanctions against Iran’s automobile, civil aviation, energy and finance sectors. However, the European states have been scrambling to ensure Iran gets enough economic benefits to persuade it to stay in the deal.
Top Tea Importing Countries – 2017
Pakistan continues be the biggest tea importer in the world, out placing Russia from year 2016. Except for Russian Federation we do not have a significant presence in any of the major tea importing countries.
Top Tea Exporting Countries – 2017
(Source: ITC)
Kenya continues to be the largest tea exporter in the world. However, China and India is seen gradually increasing their export volumes annually.
Major tea producing countries are currently witnessing healthy production levels and are expected to supersede last year’s volumes. Therefore, a decline in prices could be expected in the coming months. With a more positive global economy, rising oil prices and the devaluation of the rupee, the Sri Lankan tea prices are expected to remain at healthy levels for the rest of the year.

